Server load analysis
Guidelines for monitoring the load on your server
Server load - the percentage of the load on the characteristics of the hosting resources, namely the CPU, RAM and disk space, consumed during the execution of current tasks. Analysis of the server load will quickly understand the causes of slow work.
The hardware of any server consists of 4 main components:
- Processor
- memory
- disk
- Network interface
Analysis of server load is to collect and process statistics of each of these components.
Processor
First of all you need to check the processor. For example you can use the top utility:
root@dsde1139-22869:~# top

top - 13:29:39 up 7 days, 1:10, 1 user, load average: 0.03, 0.03, 0.00
Tasks: 104 total, 2 running, 102 sleeping, 0 stopped, 0 zombie
%Cpu(s) : 0.3 us, 1.0 sy, 0.0 ni, 97.0 id, 0.0 wa, 0.0 hi, 1.3 si, 0.3 st
MiB Mem : 969.5 total, 68.8 free, 635.9 used, 264.8 buff/cache
MiB Swap : 0.0 total, 0.0 free, 0.0 used.    106.7 avail Mem

    PID USER PR NI VIRT RES SHR S %CPU %MEM TIME+ COMMAND
    823 mysql 20 0 0 1852008 401812 0 S 1.0 40.5 81:24.20 mysqld
     13 root 20 0 0 0 0 R 0.3 0.0 26:11.00 rcu_sched
    695 redis 20 0 0 66776 4216 2100 S 0.3 0.4 19:55.21 redis-server
      1 root 20 0 0 166044 8396 5084 S 0.0 0.8 3:30.21 systemd
      2 root 20 0 0 0 0 0 S 0.0 0 0:00.09 kthreadd
      3 root 0 -20 0 0 0 0 I 0.0 0.0 0:00.00 rcu_gp
      4 root 0 -20 0 0 0 I 0.0 0.0 0:00.00 rcu_par_gp
      5 root 0 -20 0 0 0 I 0.0 0.0 0:00.00 netns
It is necessary to pay attention to the allocated sections, the CPU load usually should not exceed 10...20%.
The following indicators are the most important for analysis:
- us - user processes. A high index means that our application is loading the server.
- id - unused CPU resources. This index must be high (normal values are from 80 to 100).
- wa - waiting for I/O operations. A high value means that the processor waits very long for responses from I/O devices. Most often it is connected with a large number of disk operations.
More detailed statistics can be obtained using mpstat utility from sysstat package:
apt-get install sysstat
mpstat -P ALL
View details of all processors on the server:
root@dsde1139-22869:~# mpstat -P ALL
Linux 5.15.0-46-generic (dsde1139-22869.fornex.org) 09/06/2022 _x86_64_ (1 CPU)

02:37:21 PM CPU %usr %nice %sys %iowait %irq %soft %steal %guest %gnice %idle
02:37:21 PM all 0.90 0.00 0.74 0.13 0.00 0.96 0.32 0.00 0.00 96.95
02:37:21 PM 0.90 0.00 0.74 0.13 0.00 0.96 0.32 0.00 0.00 96.95
The htop utility will show the CPU load in a handy way:
apt-get install htop
htop
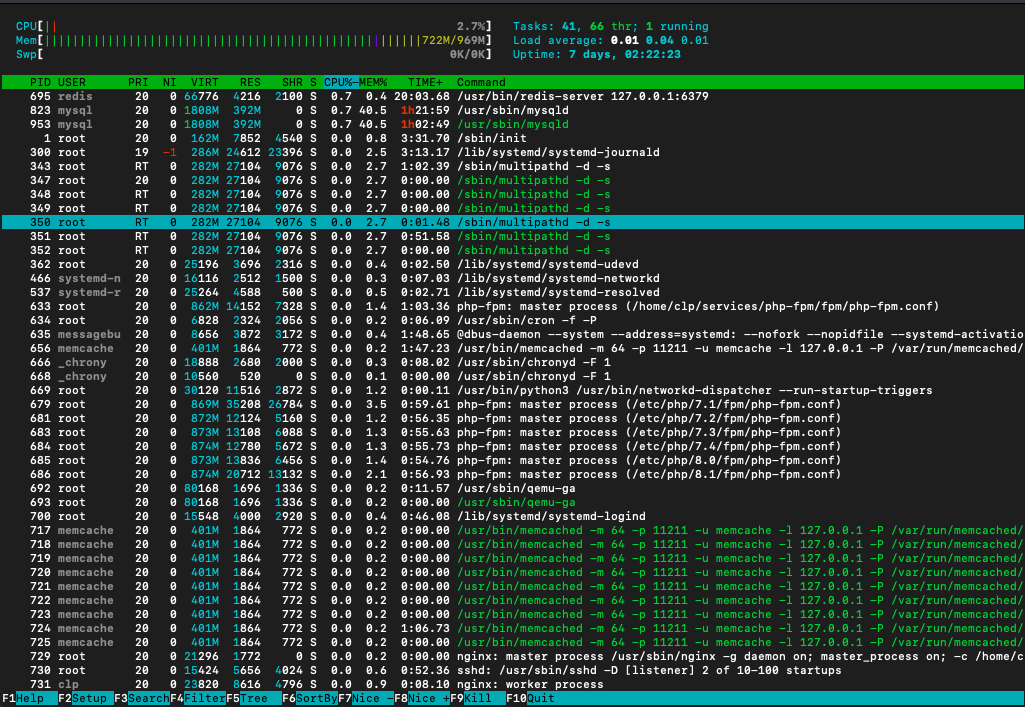
CPU load-analysis
If the CPU load index (us in the top) exceeds 20%, it is necessary to evaluate the possibility of optimizing the application, if the possible optimization has already been performed, it is necessary to purchase additional servers.
In the case of a high I/O waiting rate (wa in top'e), it is necessary to further analyze the disk and network subsystem (below).
Memory
You need to determine the amount of occupied and free memory.
free
The free tool will show you the memory usage data:
root@dsde1139-22869:~# free
               total used free shared buff/cache available
Mem: 992724 655200 73968 86748 263556 104972
Swap: 0 0 0
It is important to pay attention to the free value, which is the amount of free memory. A very important parameter is Swap - it is used disk space in case RAM is no longer sufficient.
For more information about RAM usage, see
cat /proc/meminfo
We will see this information:
root@dsde1139-22869:~# cat /proc/meminfo
MemTotal: 992724 kB
MemFree: 73192 kB
MemAvailable: 104864 kB
Buffers: 10856 kB
Cached: 226868 kB
SwapCached: 0 kB
Active: 95644 kB
Inactive: 686204 kB
Active(anon):      29728 kB
Inactive(anon):   610212 kB
Active(file):      65916 kB
Inactive(file):    75992 kB
Unevictable: 27624 kB
Unlocked:           27624 kB
You need to determine the amount of occupied and free memory.
free
The free tool will show you data on memory usage:
root@dsde1139-22869:~# free
               total used free shared buff/cache available
Mem: 992724 655200 73968 86748 263556 104972
Swap: 0 0 0
It is important to pay attention to the free value, which is the amount of free memory. A very important parameter is Swap - it is used disk space in case RAM is no longer sufficient.
For more information about RAM usage, see
cat /proc/meminfo
We will see this information:
root@dsde1139-22869:~# cat /proc/meminfo
MemTotal: 992724 kB
MemFree: 73192 kB
MemAvailable: 104864 kB
Buffers: 10856 kB
Cached: 226868 kB
SwapCached: 0 kB
Active: 95644 kB
Inactive: 686204 kB
Active(anon):      29728 kB
Inactive(anon):   610212 kB
Active(file):      65916 kB
Inactive(file):    75992 kB
Unevictable: 27624 kB
Unlocked:           27624 kB
SwapTotal: 0 kB
SwapFree: 0 kB
Dirty: 272 kB
Writeback: 0 kB
AnonPages: 571784 kB
Mapped: 99156 kB
Shmem: 86748 kB
KReclaimable: 26500 kB
Slab: 54816 kB
SReclaimable: 26500 kB
SUnreclaimable: 28316 kB
KernelStack: 2668 kB
PageTables: 5548 kB
NFS_Unstable: 0 kB
Bounce: 0 kB
WritebackTmp: 0 kB
CommitLimit: 496360 kB
Committed_AS: 7313844 kB
VmallocTotal: 34359738367 kB
VmallocUsed:       17592 kB
VmallocChunk: 0 kB
Percpu: 552 kB
HardwareCorrupted: 0 kB
AnonHugePages: 2048 kB
ShmemHugePages: 0 kB
ShmemPmdMapped: 0 kB
FileHugePages: 0 kB
FilePmdMapped: 0 kB
HugePages_Total: 0
HugePages_Free: 0
HugePages_Rsvd: 0
HugePages_Surp: 0
HugePagesize: 2048 kB
Hugetlb: 0 kB
DirectMap4k: 171884 kB
DirectMap2M: 876544 kB
Memory usage analysis
A small amount of free RAM is not a problem, but such a situation is an excuse to closely monitor the server.
In case Swap starts to grow, you need to take urgent action:
- Add RAM.
- Acquire new servers and distribute the load between them.
Disks
The disk subsystem can be stressed when an application works with files. In addition, disks can be stressed by working with the database.
You should start the disk analysis by checking the free space:
df -h
This will show results for all partitions:
root@dsde1139-22869:~# df -h
Filesystem Size Used Avail Use% Mounted on
tmpfs 97M 732K 97M 1% /run
/dev/vda1 9.8G 8.5G 846M 92% /
tmpfs 485M 0 485M 0% /dev/shm
tmpfs 5.0M 0 5.0M 0% /run/lock
tmpfs 97M 0 97M 0% /run/user/0
The Use column will show the occupied space.
The iotop tool is able to show expanded disk load.
apt-get install iotop
iotop
It will also show the distribution by processes that work on the disk:
root@dsde1139-22869:~# iotop

Total DISK READ: 0.00 B/s | Total DISK WRITE: 0.00 B/s
Current DISK READ: 0.00 B/s | Current DISK WRITE: 0.00 B/s
    TID PRIO USER DISK READ DISK WRITE SWAPIN IO> COMMAND
      1 be/4 root 0.00 B/s 0.00 B/s ?unavailable? init
      2 be/4 root 0.00 B/s 0.00 B/s ?unavailable?  [kthreadd]
      3 be/4 root 0.00 B/s 0.00 B/s ?unavailable?  [rcu_gp]
      4 be/4 root 0.00 B/s 0.00 B/s ?unavailable?  [rcu_par_gp]
      5 be/4 root 0.00 B/s 0.00 B/s ?unavailable?  [netns]
      7 be/4 root 0.00 B/s 0.00 B/s ?unavailable?  [kworker/0:0H-events_highpri]
      9 be/4 root 0.00 B/s 0.00 B/s ?unavailable?  [mm_percpu_wq]
     10 be/4 root 0.00 B/s 0.00 B/s ?unavailable?  [rcu_tasks_rude_]
     11 be/4 root 0.00 B/s 0.00 B/s ?unavailable?  [rcu_tasks_trace]
     12 be/4 root 0.00 B/s 0.00 B/s ?unavailable?  [ksoftirqd/0]
     13 be/4 root 0.00 B/s 0.00 B/s ?unavailable?  [rcu_sched]
     14 be/4 root 0.00 B/s 0.00 B/s ?unavailable?  [migration/0]
     15 be/4 root 0.00 B/s 0.00 B/s ?unavailable ?  [idle_inject/0]
     17 be/4 root 0.00 B/s 0.00 B/s ?unavailable?  [cpuhp/0]
     18 be/4 root 0.00 B/s 0.00 B/s ?unavailable?  [kdevtmpfs]
     19 be/4 root 0.00 B/s 0.00 B/s ?unavailable?  [inet_frag_wq]
     20 be/4 root 0.00 B/s 0.00 B/s ?unavailable?  [kauditd]
     21 be/4 root 0.00 B/s 0.00 B/s ?unavailable?  [khungtaskd]
Analysis of the disk subsystem
If the disk is exposed to a large number of reads, the correct behavior would be:
- In case most of the reads are from the application, you need to enable APC caching.
- In the case of a database, make sure that its parameters are properly configured.
- If reads occur as a result of accessing a Web server, consider using the HTTP cache.
A large number of writes to disk usually indicates the need to scale.
- Make sure you have all access and debug logs disabled.
- Most disk writes are likely to be generated by the database.
- A large number of writes may also generate downloadable files.
Network
The cbm utility allows you to see network traffic in real time:
apt-get install cbm
cbm
We will see data about the amount of traffic per second:
 Interface Receive Transmit Total
  lo 0.00 B/s 0.00 B/s 0.00 B/s
  eth0 35.90 kB/s 758.75 B/s 36.65 kB/s
High network traffic by itself is not a problem. But the near-peak values indicate a need to scale in the near future.
General statistics
The dstat utility will show you the overall real-time server statistics:
apt-get install dstat
dstat
We will see system data at one-second intervals:
root@dsde1139-22869:~# dstat
You did not select any stats, using -cdngy by default.
--total-cpu-usage-- -dsk/total- -net/total- ---paging-- ---system--
usr sys idl wai stl| read writ| recv send| in out | int csw
  2 1 97 0 0| 35k 29k| 0 0 | 0 0 | 683 702
  1 0 99 0 0| 124k 0 | 39k 1162B| 0 0 |1003 822
  3 4 86 6 1|3580k 8776k| 37k 522B| 0 0 |1161 1018
  2 2 95 1 0|3888k 0 | 37k 2808B| 0 0 |1054 995
  3 0 96 0 1| 0 0 | 34k 444B| 0 0 | 919 810
  4 0 96 0 0| 756k 72k| 31k 702B| 0 0 | 872 790
  5 2 93 0 0| 0 0 | 25k 624B| 0 0 | 739 724
  1 1 97 0 1| 0 0 | 22k 436B| 0 0 | 622 638
  1 1 98 0 0| 0 0 | 17k 770B| 0 0 | 520 599
  1 0 99 0 0| 0 0 | 13k 436B| 0 0 | 449 572
  1 0 99 0 0| 0 0 |9005B 504B| 0 0 | 376 533
  0 1 98 0 1| 0 0 |7293B 648B| 0 0 | 332 495
  3 1 95 1 0| 288k 244k|6697B 770B| 0 0 0 | 371 562
  2 0 98 0 0| 0 0 |6435B 350B| 0 0 | 349 520
  0 1 99 0 0| 0 0 |6971B 640B| 0 0 | 334 513
  3 1 96 0 0 0| 0 0 | 13k 342B| 0 0 | 498 625
  1 0 99 0 0| 0 0 | 22k 770B| 0 0 | 692 744
  2 1 96 0 1| 0 0 | 33k 598B| 0 0 | 900 810
Attention should be paid to:
- total-cpu-usage - CPU load
- dsk/total - disk load
- net/total - network load
If you have any difficulties or any additional questions, you can always contact our support service via Ticket system.