Any server, has a limited amount of resources. Each program running in active or background mode uses a certain amount of virtual and physical memory, CPU time, etc. In other words, creates a certain load on the server.
It allows you to display a list of running processes in the form of a table and estimate how much resources they consume, i.e. how much load they create on the server and disk subsystem. This information helps to further optimize the system.
To do this, connect to the server via SSH and type top - Enter and you will see a table with the list of running processes. Initially the list is compiled in descending order of processor load.
Running the top command and deciphering the table
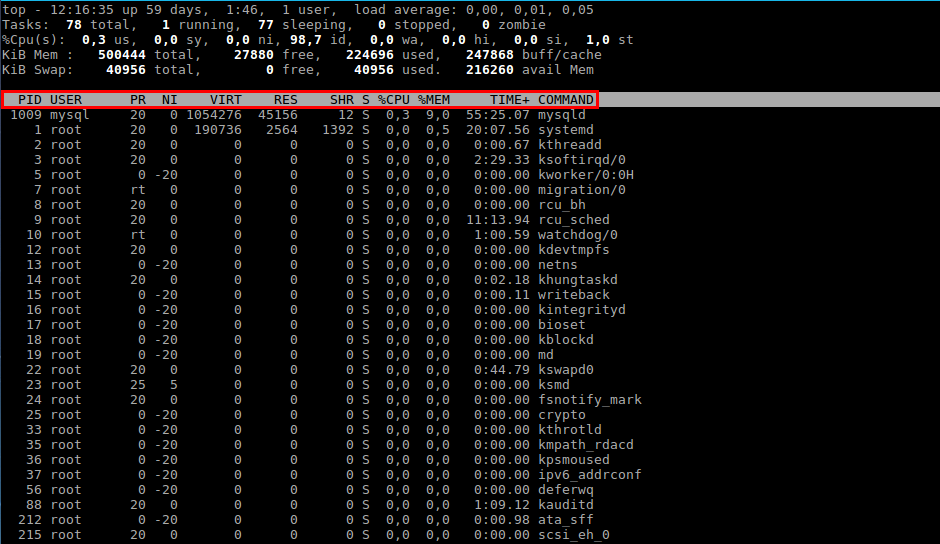
The first two columns are the process number (PID) and the name of the user running it (USER).
The next 2 columns show what priority the process has at the moment (PR) and the priority assigned to it by the NICE (NI) command.
The information in the other columns describes directly the level of resource consumption. They are decoded as follows:
-
VIRT - virtual memory used by the process
-
RES - physical memory used by the given process
-
SHR - total amount of memory, shared by the given process with others
-
S - current process status: R - running; S - sleeping, Z - zombie
-
%CPU - percentage of CPU time used
-
%MEM - percentage of RAM used by the process
-
TIME+ - process duration from the moment of its start
-
COMMAND - name of the command (program) which initiated the process.
Data decoding before the table
Useful information about the use of resources is contained not only in the table itself, but also in the five lines that precede it. They are a kind of summary on all the processes.
The first line gives us a general idea of the system load (top)

-
current time
-
up - the duration of the system from the moment of startup
-
user - current number of system users
-
load average - average load of the system one minute ago, five minutes ago and 15 minutes ago, respectively.
It is believed that this value should not normally exceed 1 for single-core processors. Correspondingly, the load average value equal to the number of cores is the limit.
The second line - process statistics (task)

-
total - total number of processes in the system
-
running - number of currently running processes
-
sleeping - number of pending processes
-
stopped - number of stopped processes
-
zombie - number of processes waiting for the parent process to transmit termination status
The third line - statistics of CPU usage (cpu)

-
us - the percentage of CPU usage by user processes
-
sy - the percentage of CPU usage by system processes
-
ni - percentage of CPU usage by processes with priority increased by calling
-
id - percentage of time when the CPU is not used
-
wa - percentage of CPU usage by processes waiting for I/O operations to complete
-
hi - Hardware IRQs - percentage of CPU usage by hardware interrupt handlers
-
si - Software Interrupts - percentage of CPU usage by software interrupt handlers
-
st - Steal Time - the amount of CPU time "borrowed" from the virtual machine by the hypervisor for other tasks (such as another virtual machine startup); this value will be zero on desktops and servers not running virtual machines
The fourth and fifth lines display information about the use of physical RAM and swap partition respectively (swap). Values in order: total memory (total), used memory (used), free memory (free), buffer cache (buffers).

Add columns and sort table top
We now know what information is encoded in each column of the top table. The basic sorting is done by CPU time utilization, aka %CPU. To perform sorting by memory (%MEM) in top, just type Shift+M in the top command mode. If you are interested in which process is running the longest, press Shift+T and you will see the information of interest in the TIME+ column. You can sort processes by their number (PID) by typing Shift+N.
To return to sorting mode by CPU resource consumption level, use combination Shift+P.
Not all sorting methods can be set with the help of "hotkeys". For example, to determine the processes that consume the most SWAP, use the field selection menu, which is called by the combination Shift+F.
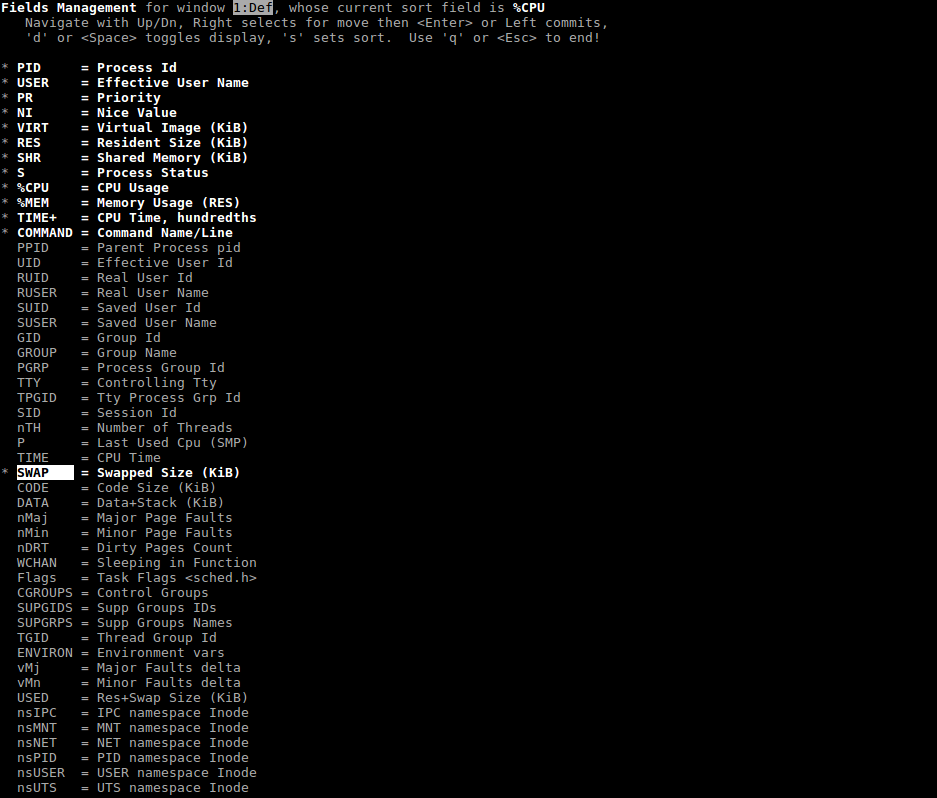
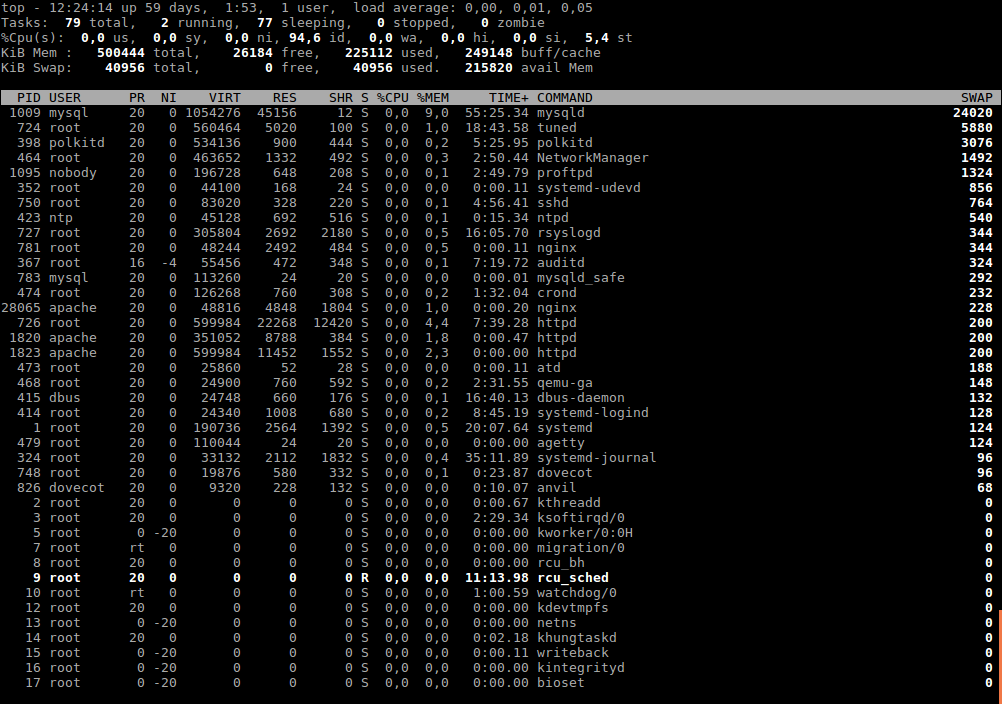
Use navigation keys to find SWAP (or any other parameter you need), use "d " to add it to the common table of top command (a "" symbol will appear near it to confirm your choice). To set sorting by SWAP, press "s" here and exit the menu (ESC)*
To make sure that sorting works by the specified attribute, press "x ". The column with the corresponding attribute will be highlighted (highlighted in bold).
There is a more convenient utility called atop, more details about its functionality can be found on this [page] (https://fornex.com/help/atop/).
If you have any configuration difficulties or any additional questions, you can always contact our support team via [ticket system] (https://fornex.com/my/tickets/).