Использование ресурсов в cPanel
Следить за потреблением ресурсов можно благодаря разделу Метрики в панели управления cPanel
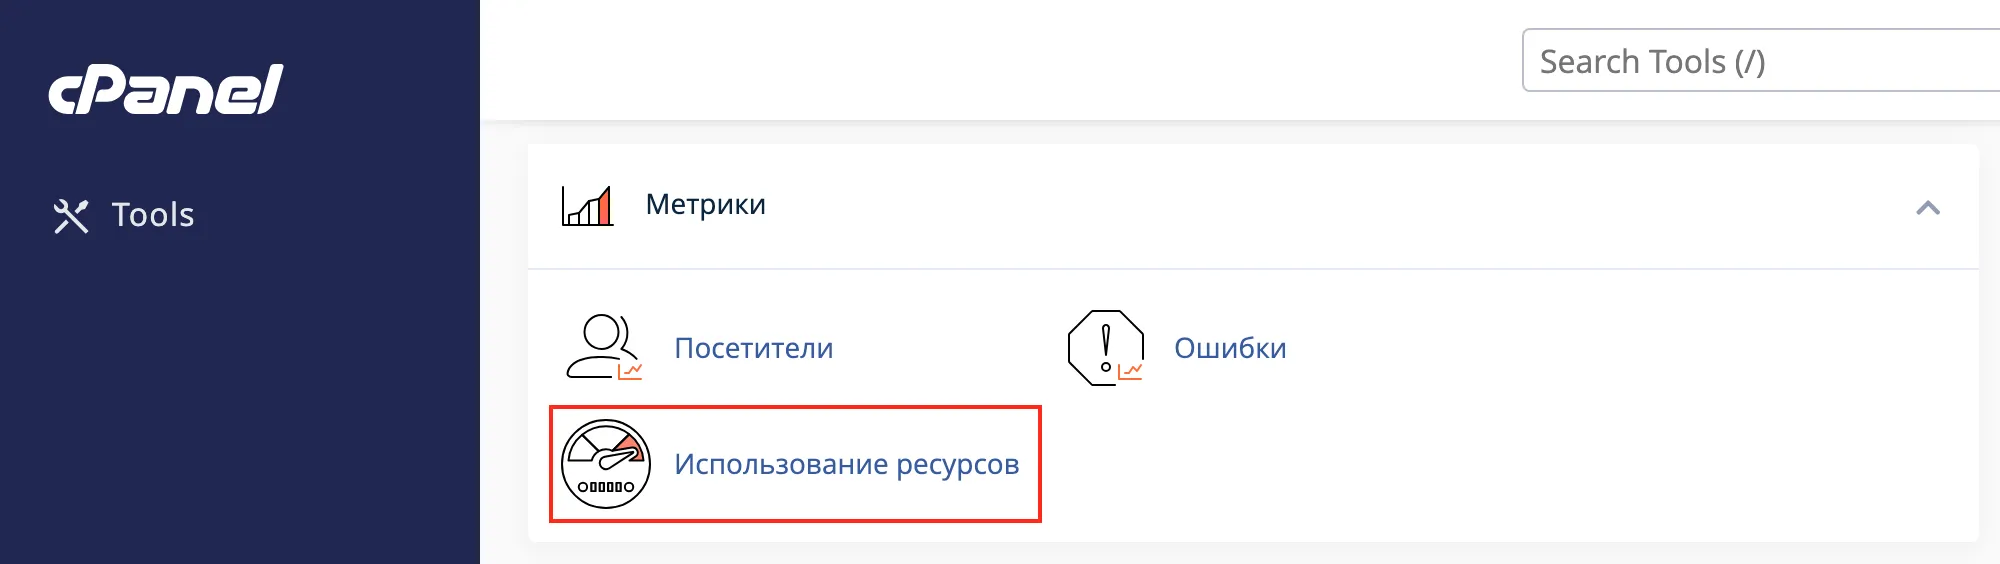
Данный сервис находится в разделе «Метрики → Использование ресурсов»
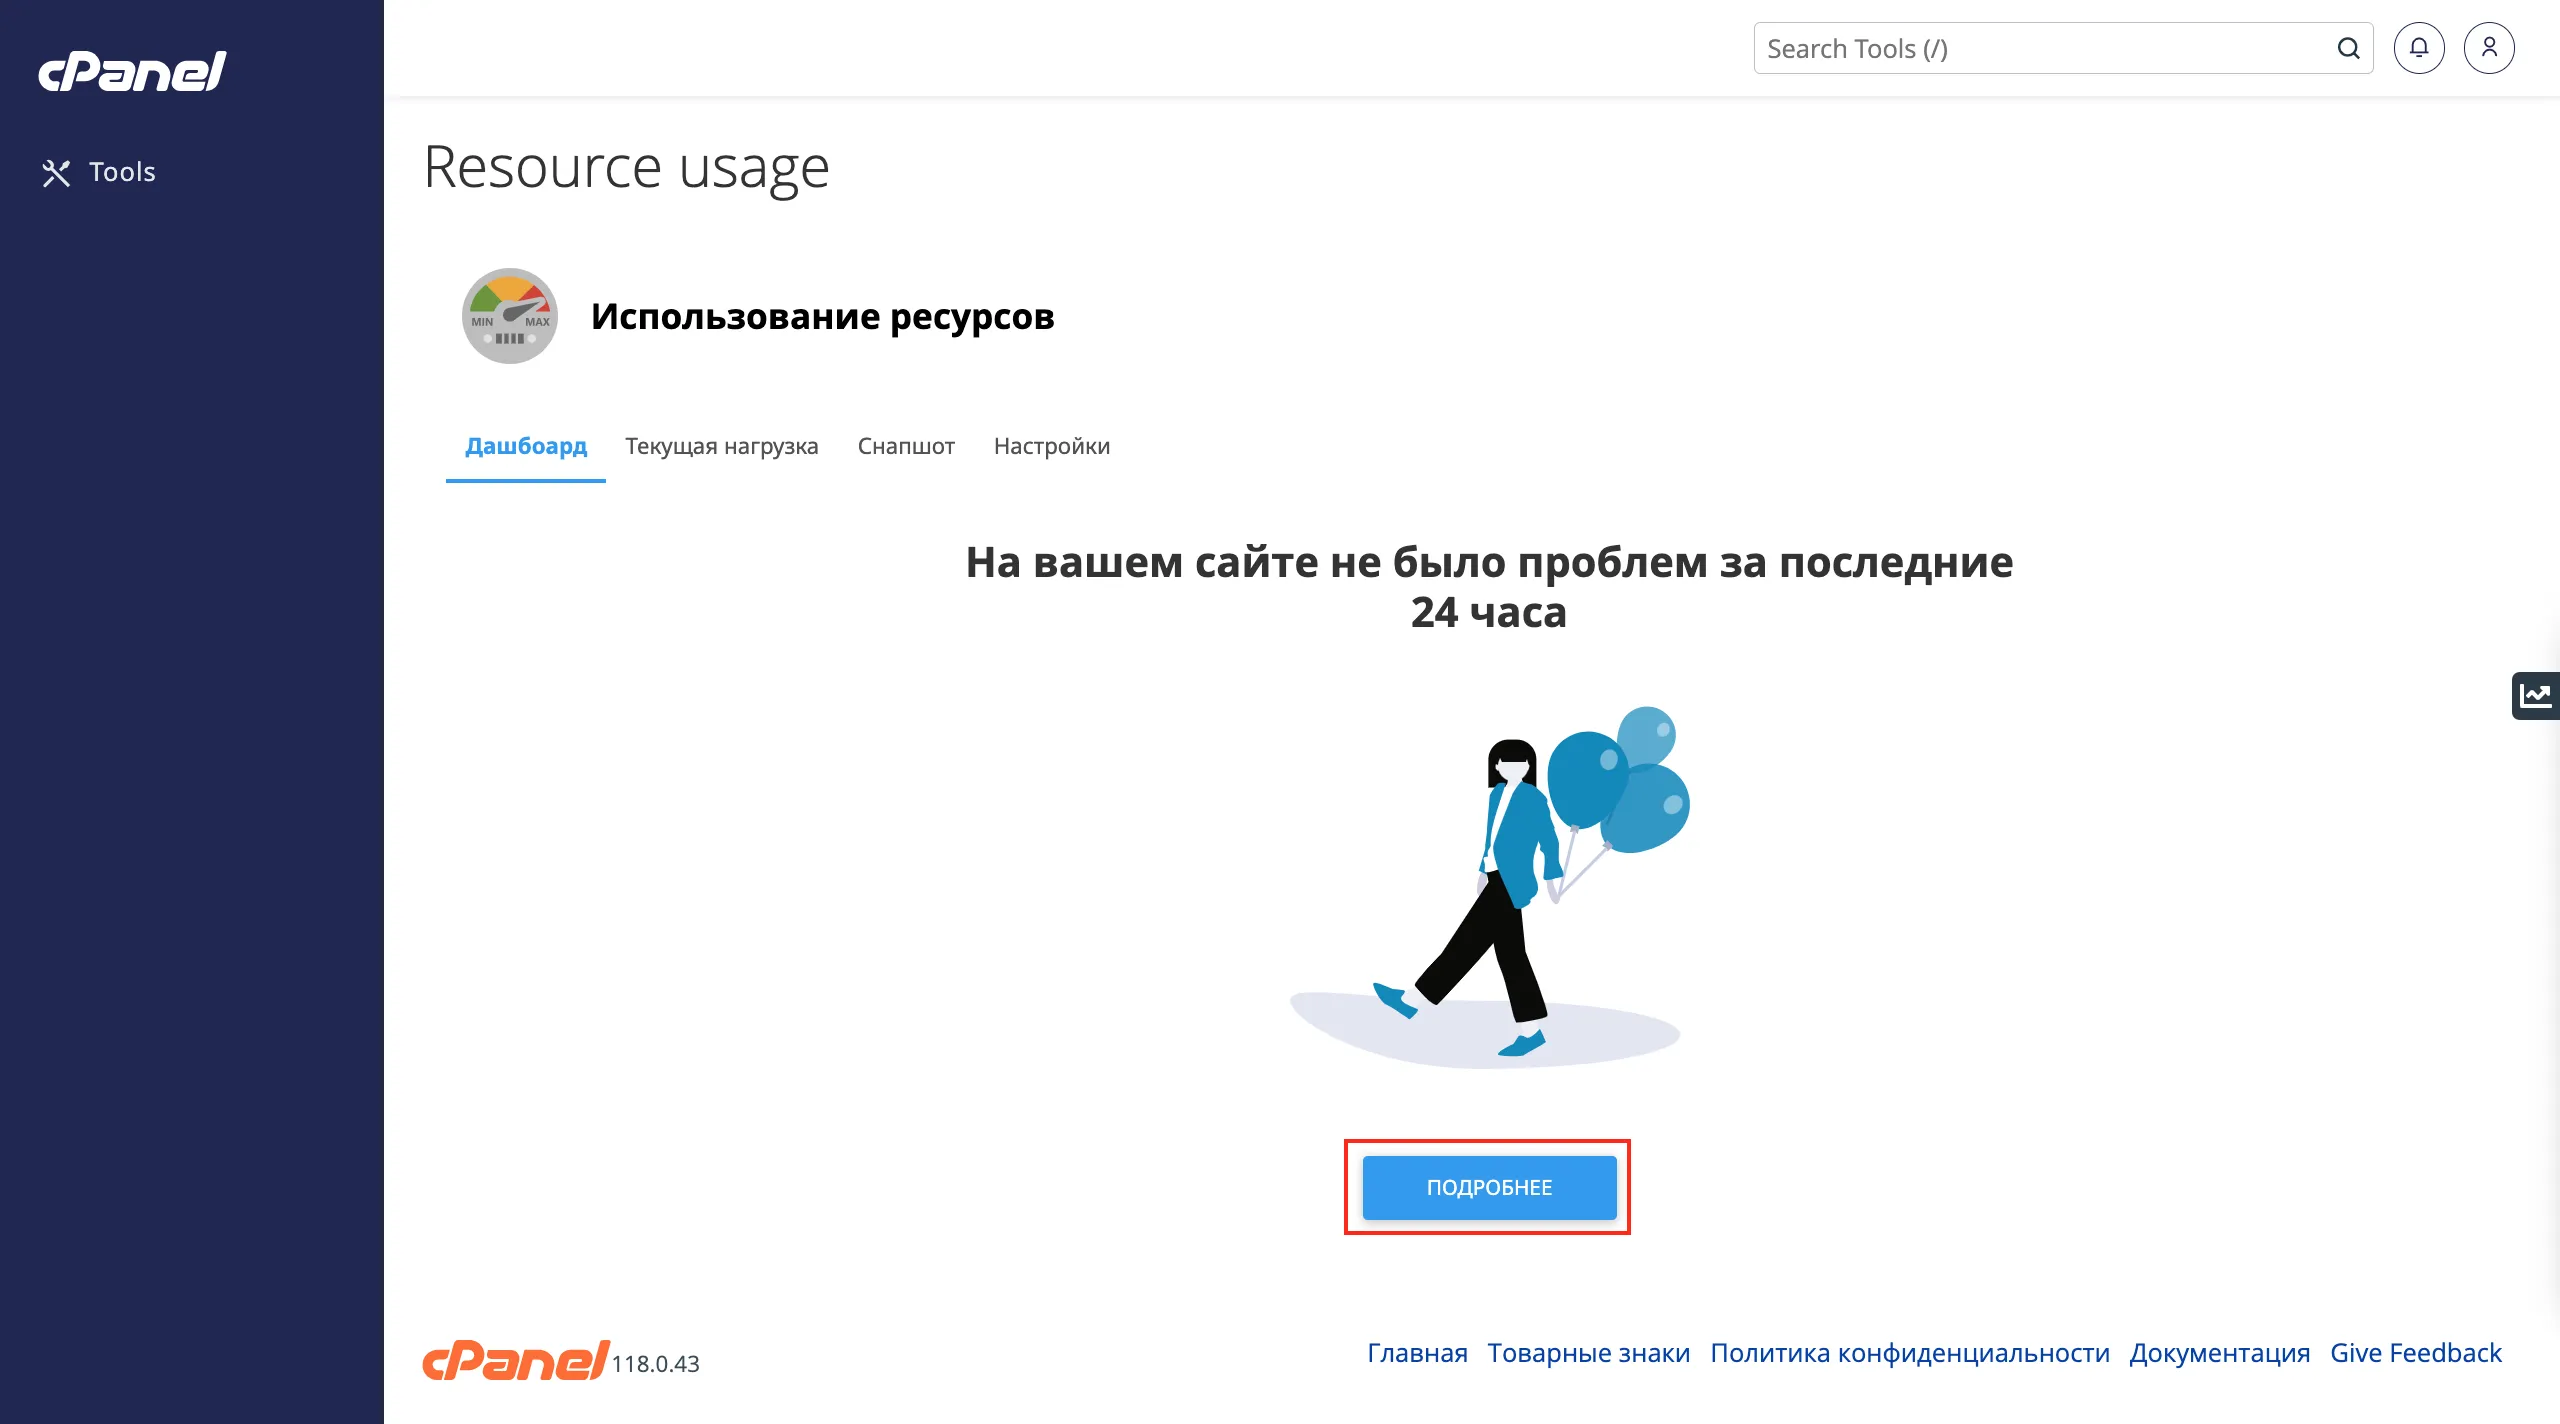
На странице использования ресурсов, cPanel отображает сводку по вашей учетной записи. В зависимости от использования ресурсов вашей учетной записи, вы можете одно из следующих сообщений:
-
Your site had no issues in the past 24 hours/На вашем сайте не было проблем за последние 24 часа.
- Если вы получили это сообщение, то в вашей учетной записи не было никаких ограничений в течение последних 24 часов.
-
Your site has been limited within the past 24 hours/Ваш сайт был ограничен в течение последних 24 часов.
- Если вы получили это сообщение, ваша учетная запись упиралась в как минимум один лимит ресурсов за последние 24 часа. cPanel отображает дополнительную информацию о том, какой ресурс (или ресурсы) вызвал ограничение.
-
Your site might hit resource limits soon/Ваш сайт может скоро превысить лимит ресурсов.
- Это сообщение является предупреждением о том, что ваша учетная запись может вызвать ограничение ресурсов в ближайшем будущем.
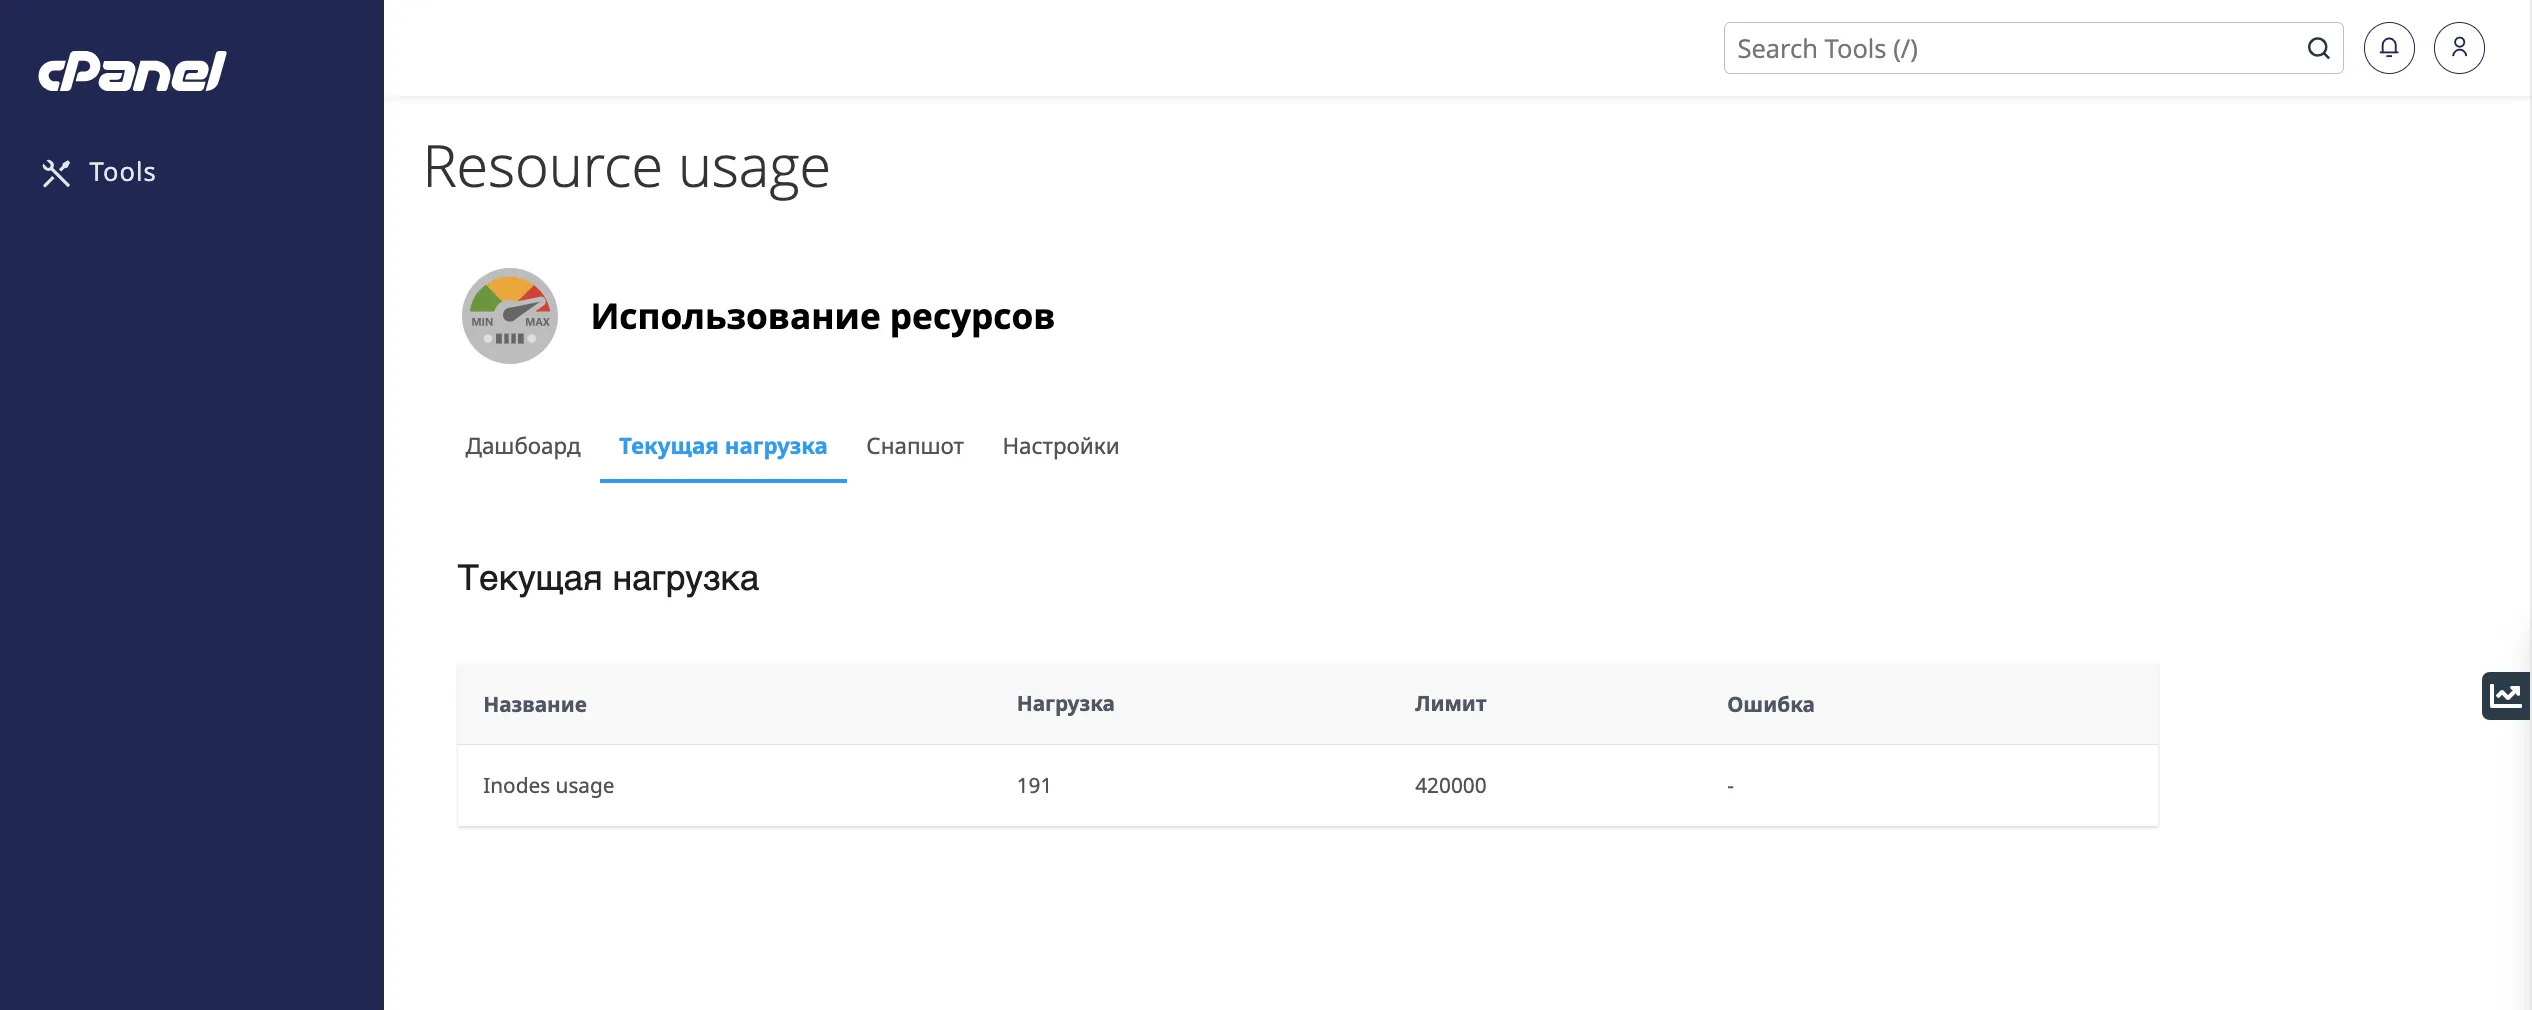
Чтобы просмотреть подробную информацию о использовании ресурсов, нажмите кнопку «Details/Подробнее» или перейдите на вкладку «Current Usage/Текущая нагрузка». cPanel отображает графики использования и таблицу использования.
По умолчанию cPanel отображает информацию об использовании ресурсов за текущий день. Чтобы изменить отображаемый интервал времени, в окне списка Timeframe выберите диапазон времени, который будет отображаться. В списке Time Unit выберите интервал между точками данных, которые будут отображаться.
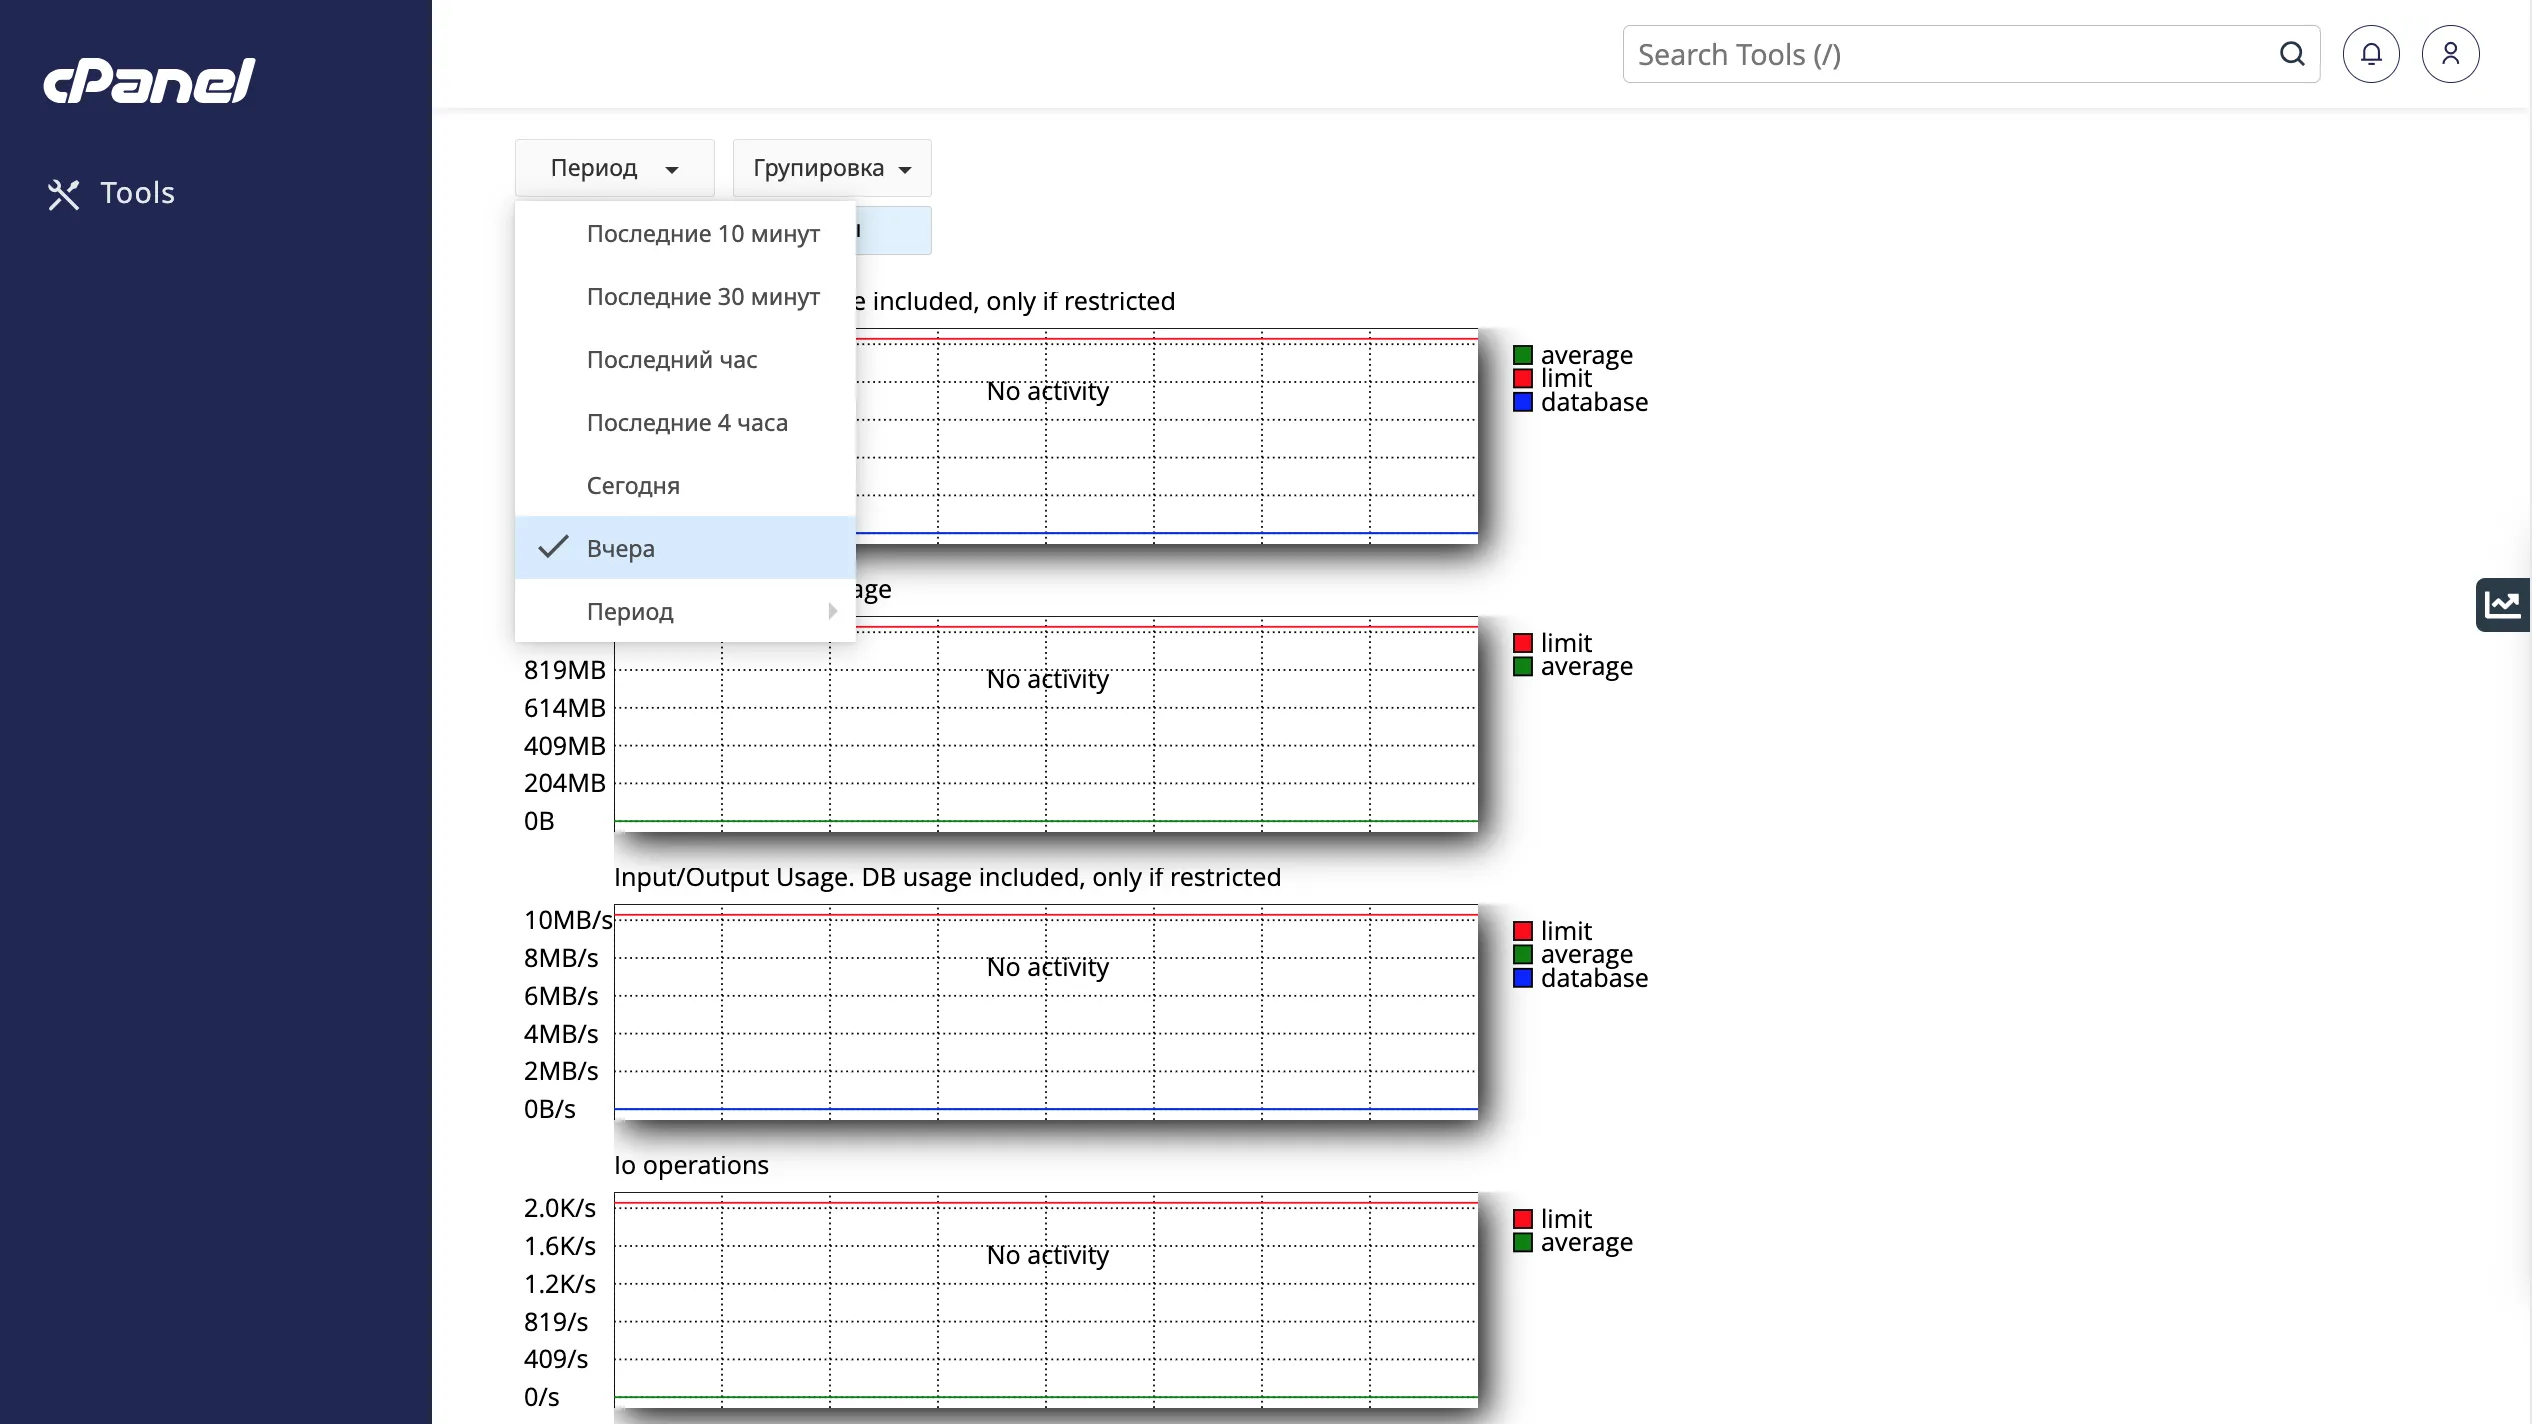
SPEED Usage — ограничения ввода-вывода которые ограничивают пропускную способность данных для пользователя. Когда предел достигнут, процессы усыпляются, но не прекращают работать и не завершаются, только работают медленнее.
I/O (input/output) Usage — использование устройств чтения/записи. Показывает сколько байт было считано из файлов или стандартных потоков ввода/вывода (stdin и stdout). Нехватка данного ресурса, отражается на скорости работы Вашего сайта.
IOPS — данный лимит ограничивает общее число операций чтения/записи в секунду. Когда предел достигнут, операции чтения/записи прекращаются до тех пор, пока не истечет текущая секунда. Лимит IOPS ограничивает общее число операций чтения/записи в секунду.
NPROC — этот параметр контролирует общее количество процессов, запущенных от имени пользователя. Как только предел достигнут, новый процесс не может быть создан. В этом случае на сайте вы можете видеть 500 или 503 ошибки.
Entry Processes — здесь ведется учет процессов, создаваемых аккаунтом. Данный показатель не равен количеству посетителей сайта. Процесс как единица возникает при запросе CGI/PHP и занимает доли секунды.
Physical Memory Usage — в данном разделе можно увидеть, сколько физической памяти занято запущенными процессами. Каждая загружаемая страница, скрипт или включенный PHP-модуль в вашем аккаунте требуют определенный объем памяти.
Inodes — это объекты файловой системы, в которых хранится информация о файлах и папках. 1 инод ровняется 1 файлу. Если же лимит по количеству индексных дескрипторов будет превышен — работа вашего сайта и почты будет некорректной.
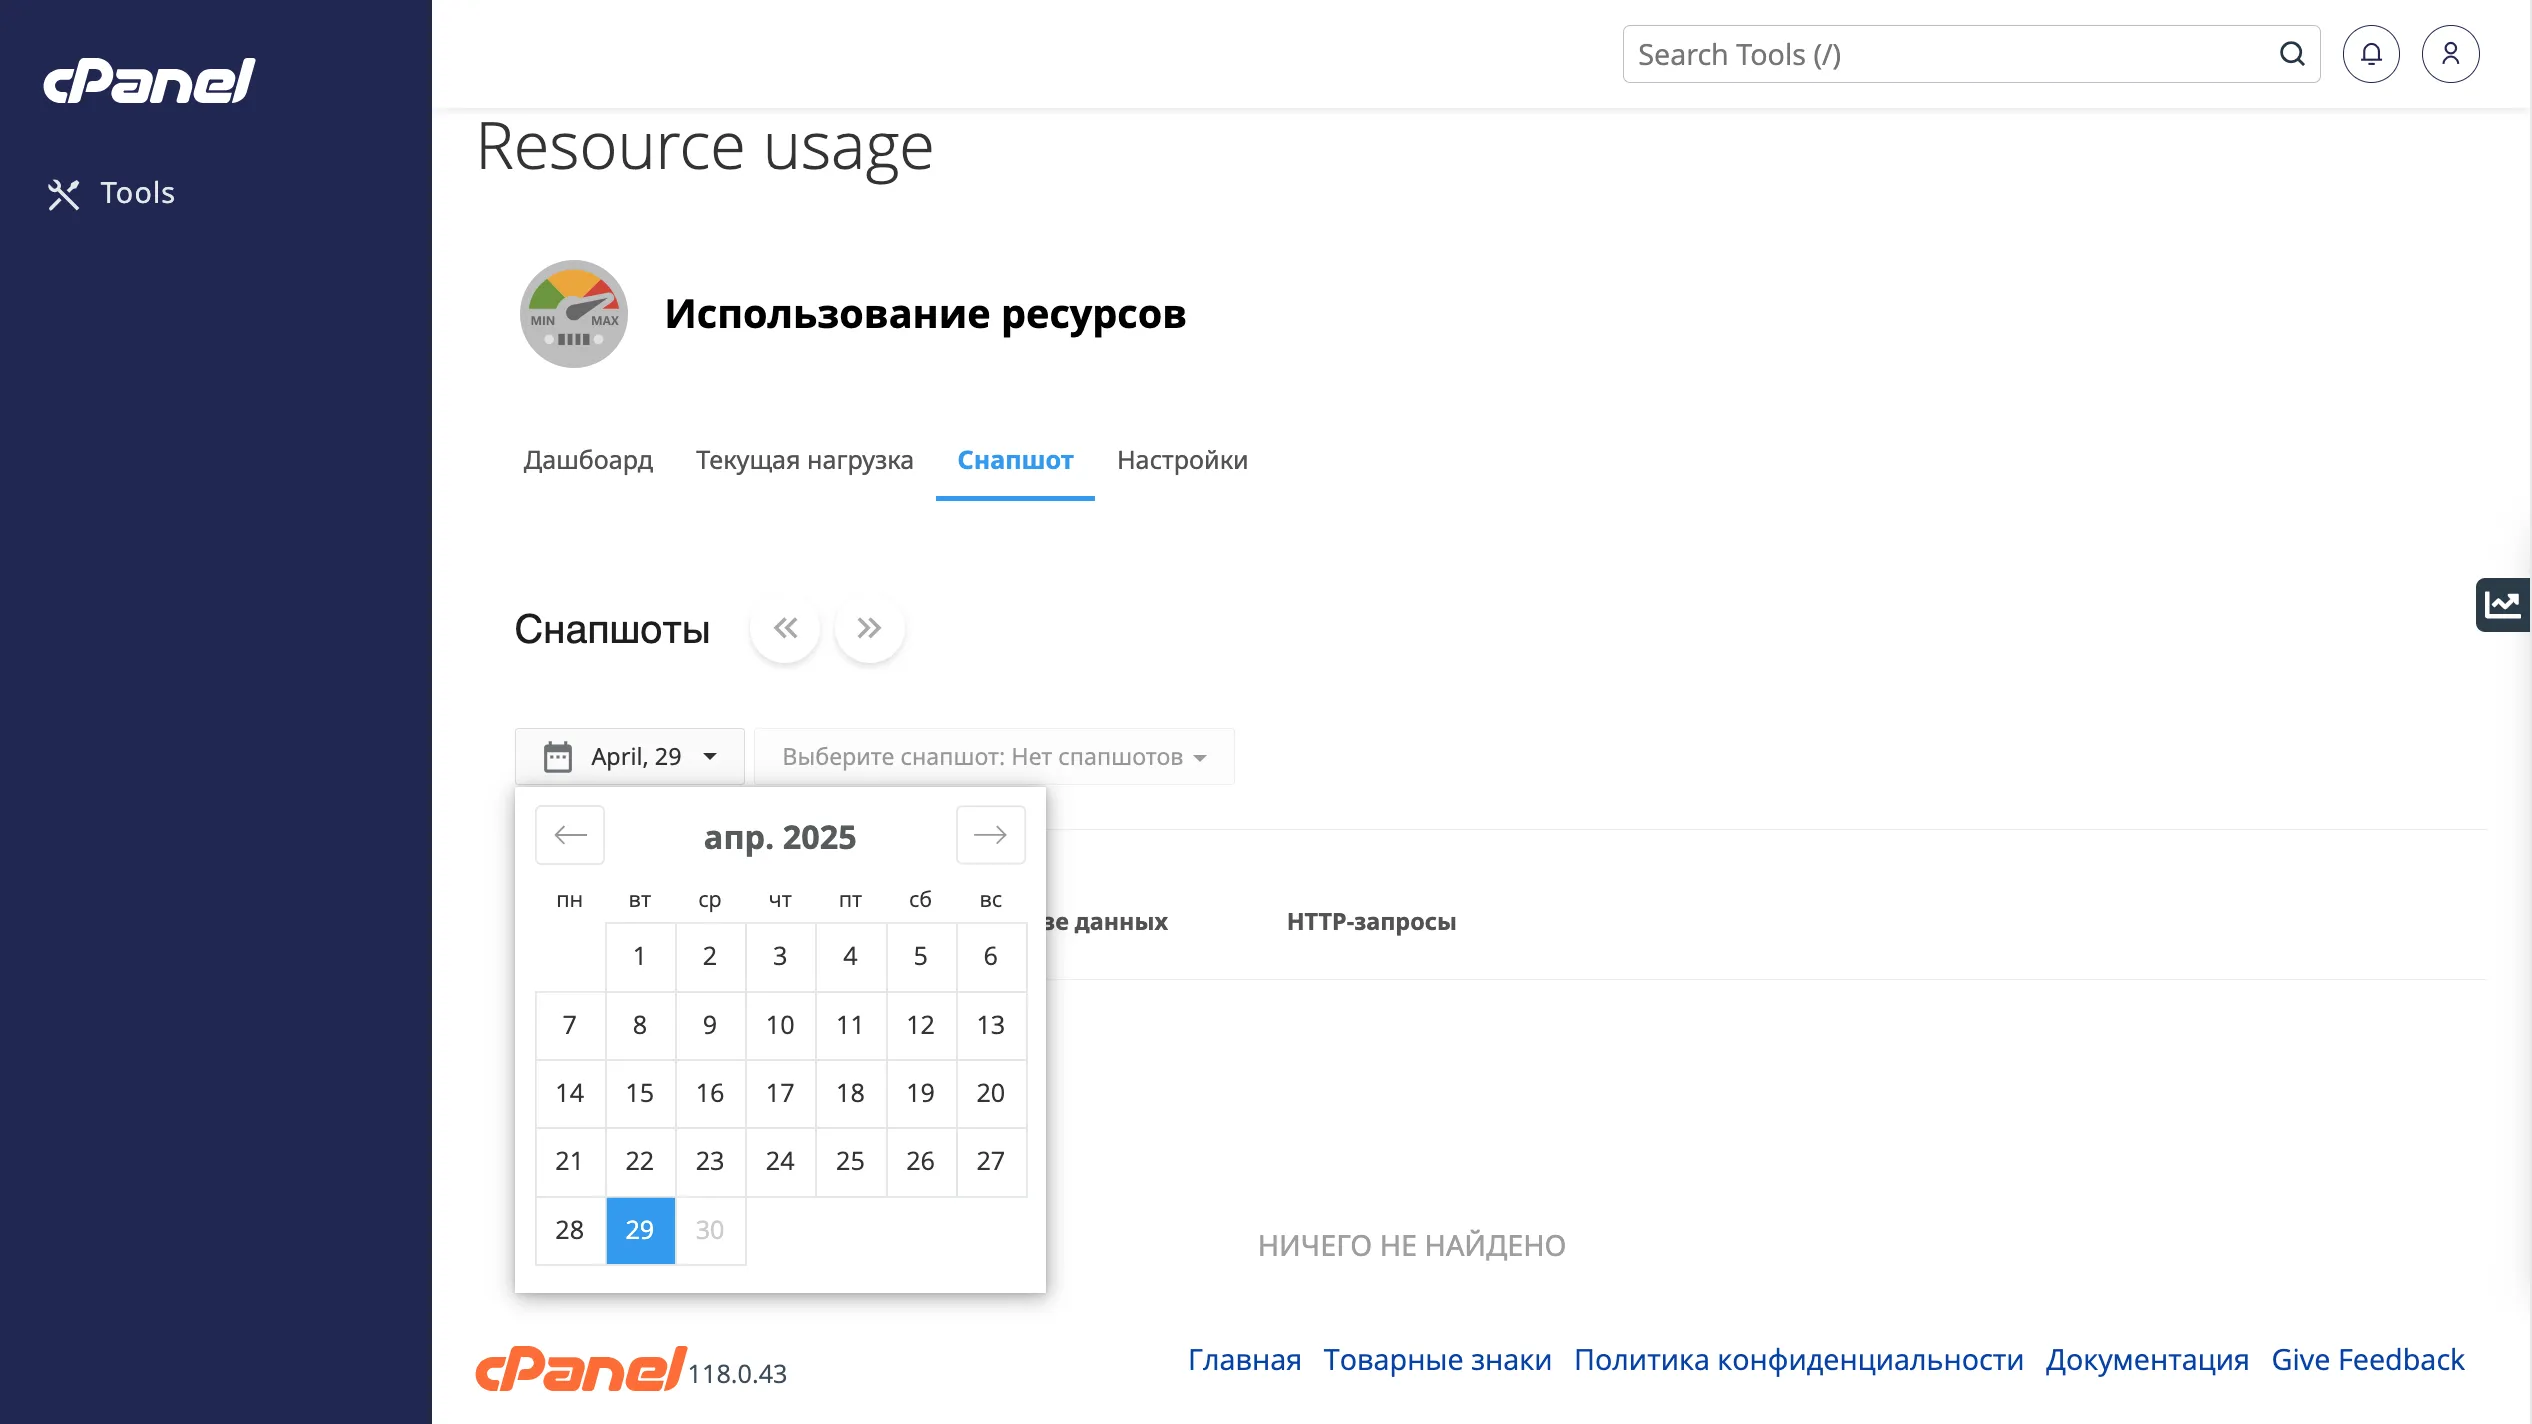
Вы можете просмотреть cнапшот использования ресурсов, перейдите на вкладку «Snapshot/Снапшот». В зависимости от использования ресурсов вашей учетной записи, cPanel может отображать список процессов, список запросов к базе данных и HTTP-запросы.
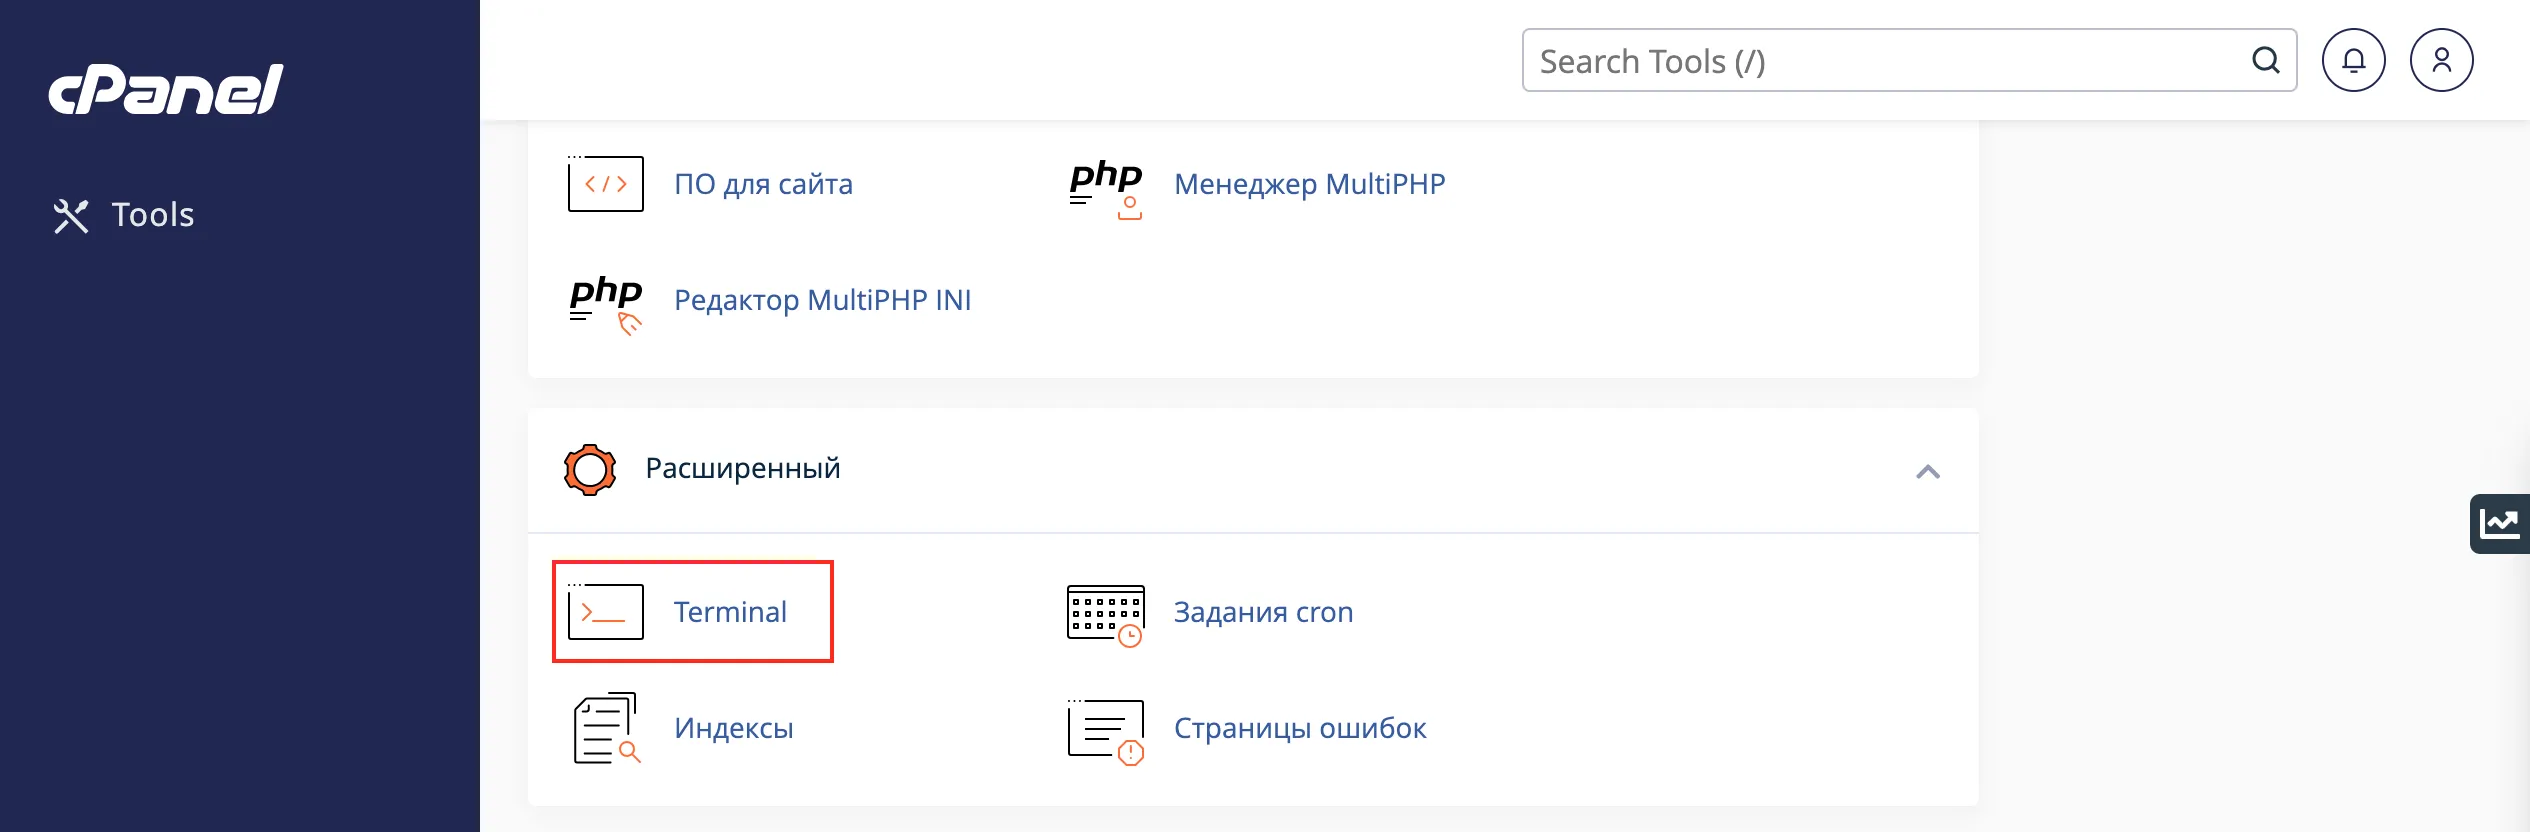
Также вы можете просмотреть список всех процессов через «Terminal».
Для этого достаточно ввести команду:
ps aux
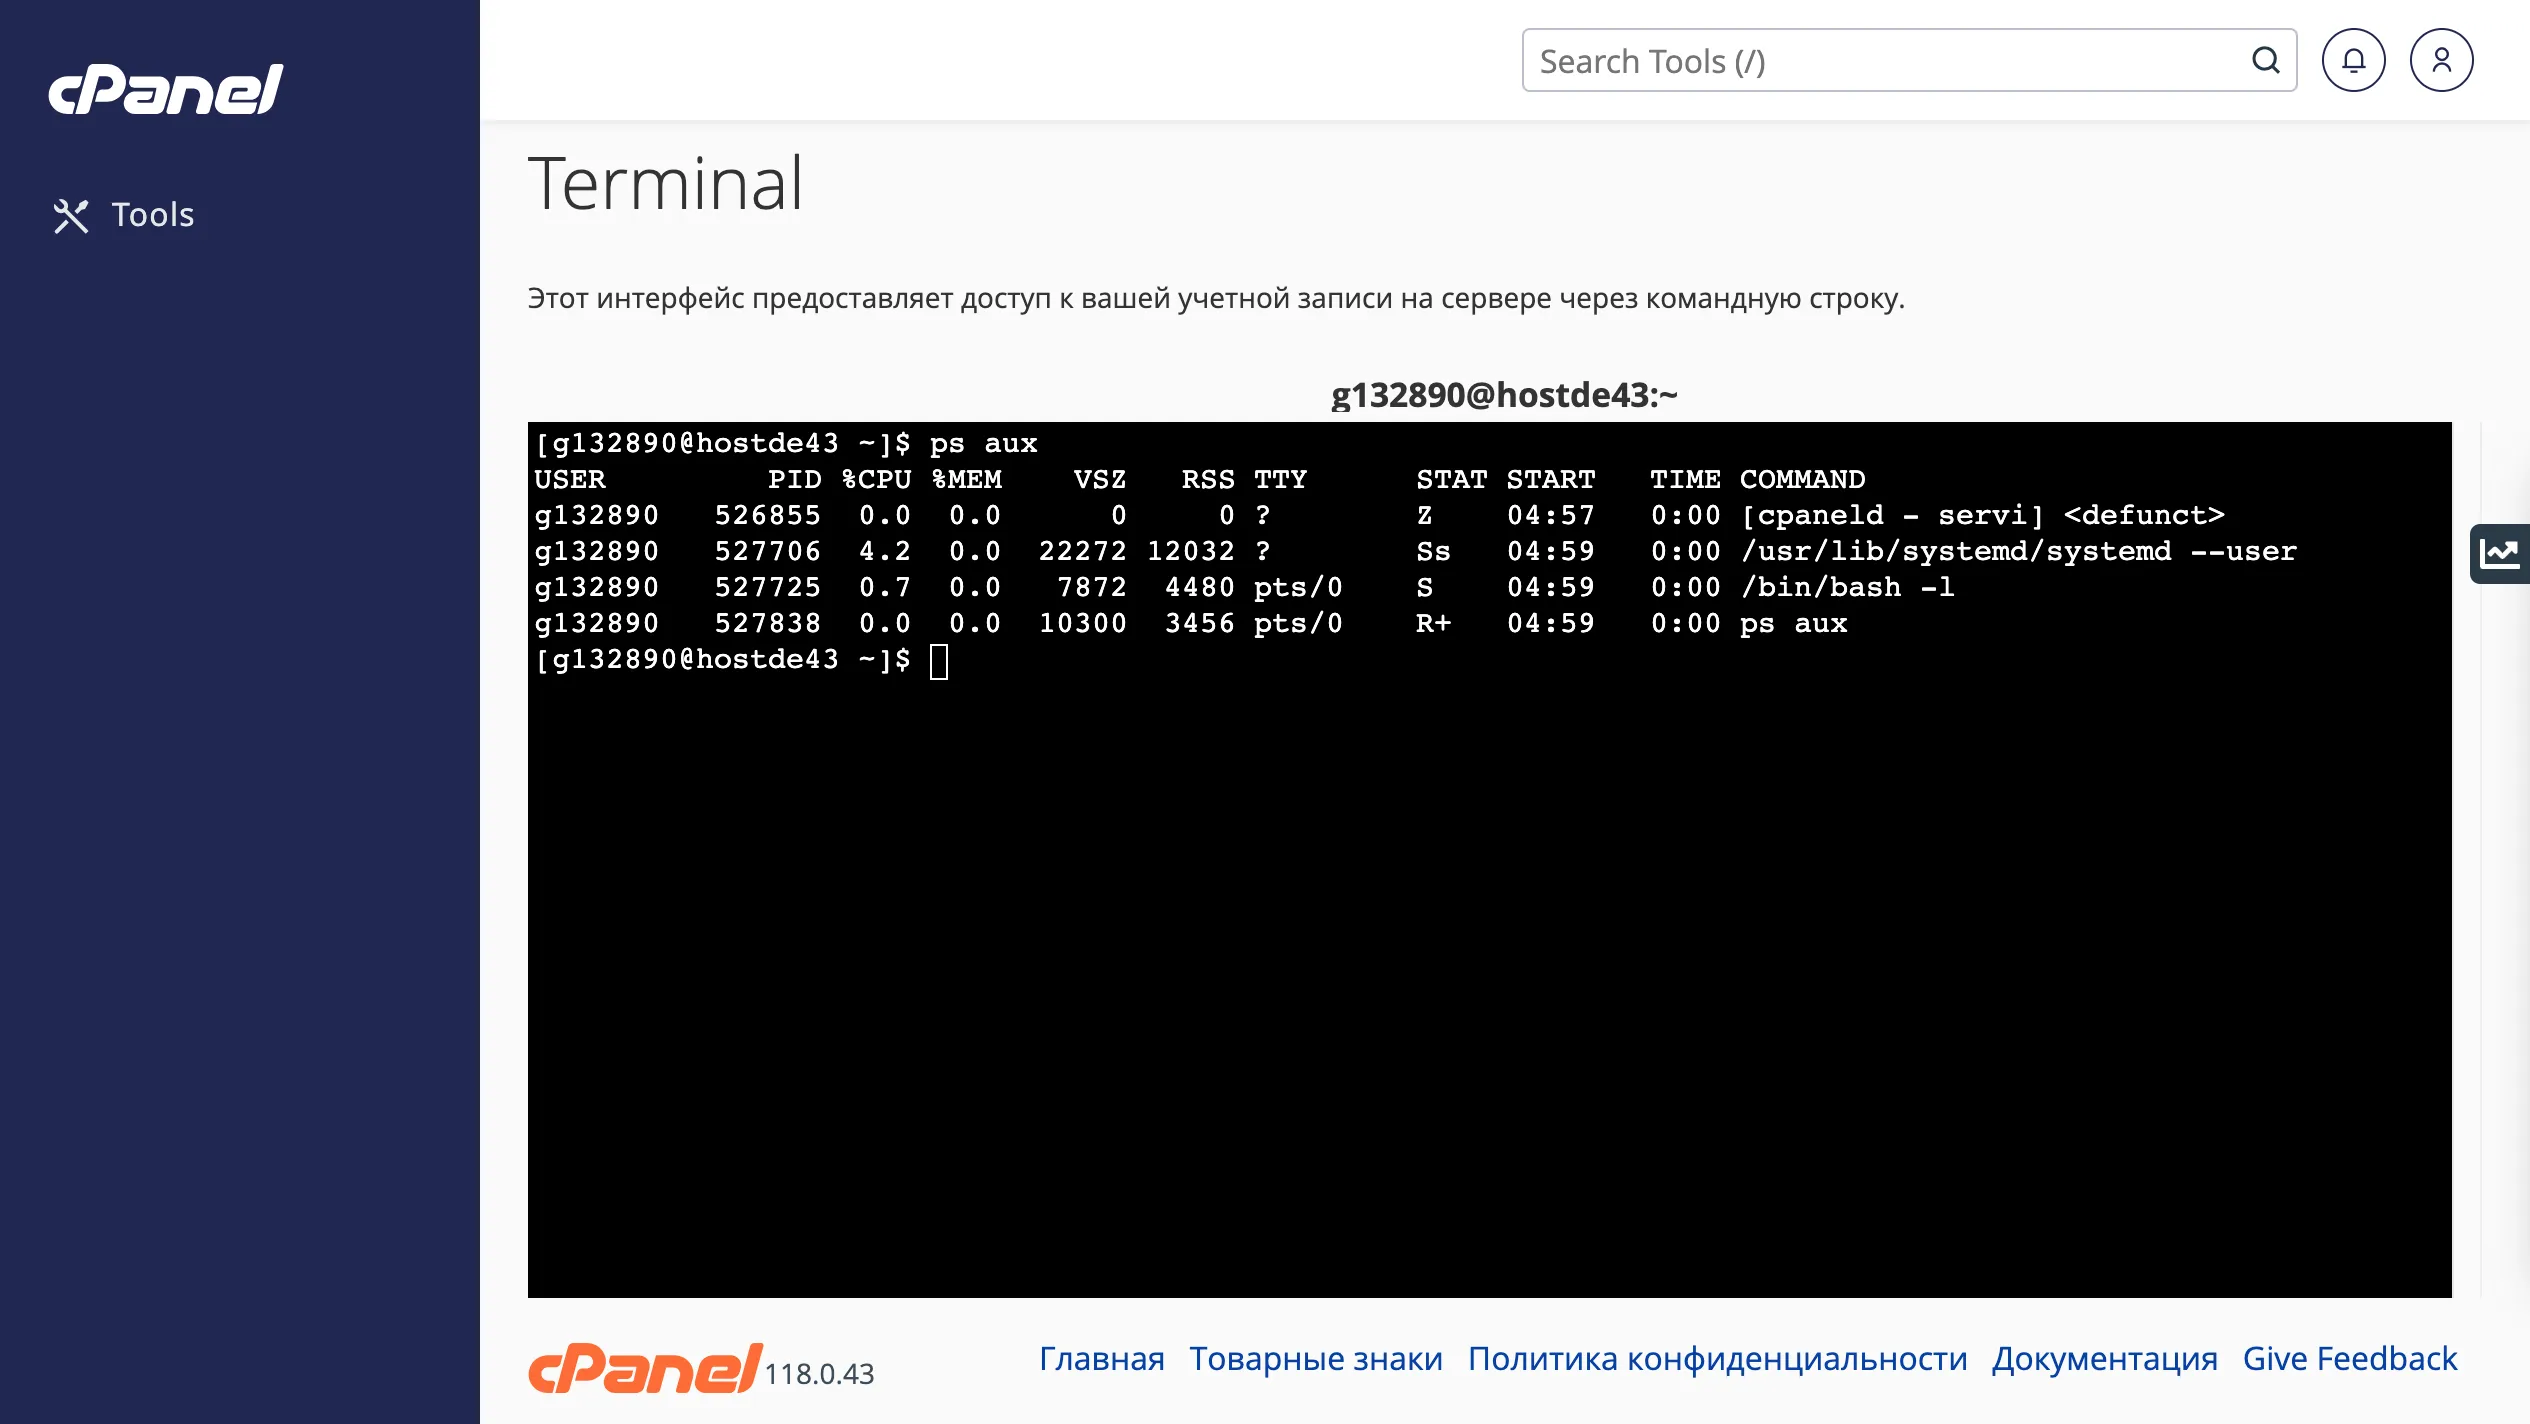
Какую информацию можно получить по каждому процессу:
- PID, PPID – идентификатор процесса.
- %CPU – доля процессорного времени, выделенная процессу.
- %MEM – процент используемой оперативной памяти.
- VSZ – виртуальный размер процесса.
- TTY – управляющий терминал.
- STAT – статус процесса.
- START – время запуска.
- TIME – время исполнения на процессоре.
Команда ps делает моментальный снимок процессов в текущий момент.
Помощь
Если у вас возникли трудности или необходима помощь, пожалуйста, создайте запрос в службу поддержки через тикет-систему, и мы с радостью вам поможем.