In order to view the resource statistics on the server you need to go to the tab "Graphs ".
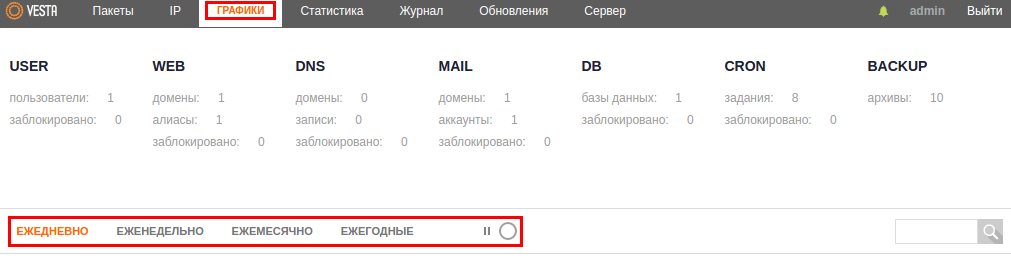
To customize the display of graphs for different period, select the appropriate tab: day, week, month, year. To stop the collection of statistics, you must click on pause.
In the Graphs menu graphs of the state of the main services on the server will be presented.
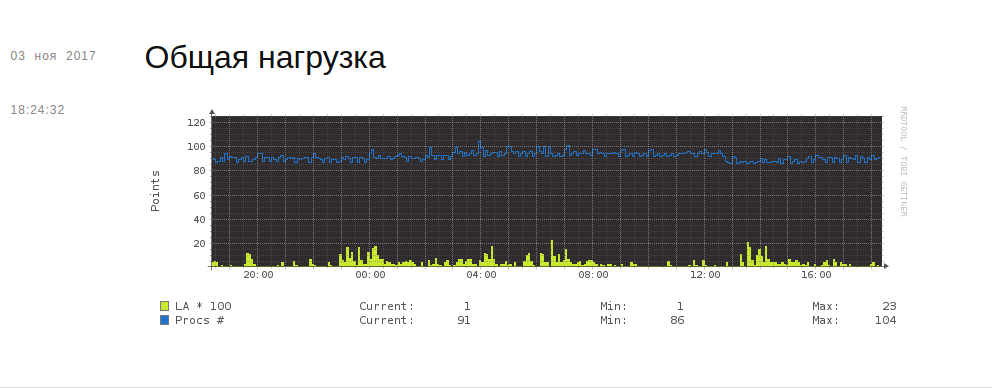
"General load"
This graph shows the load on the system at a moment in time. The normal value of this parameter should not exceed the total value of the cores in the system
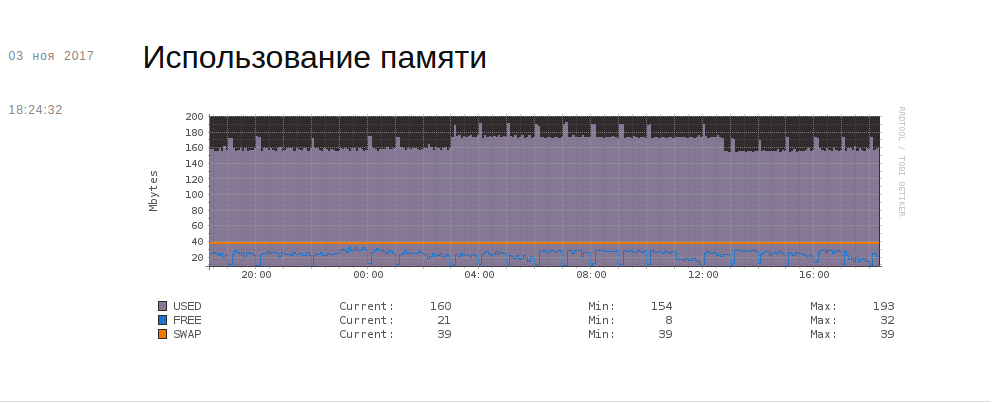
"Memory usage"
This graph shows the memory usage at a point in time.
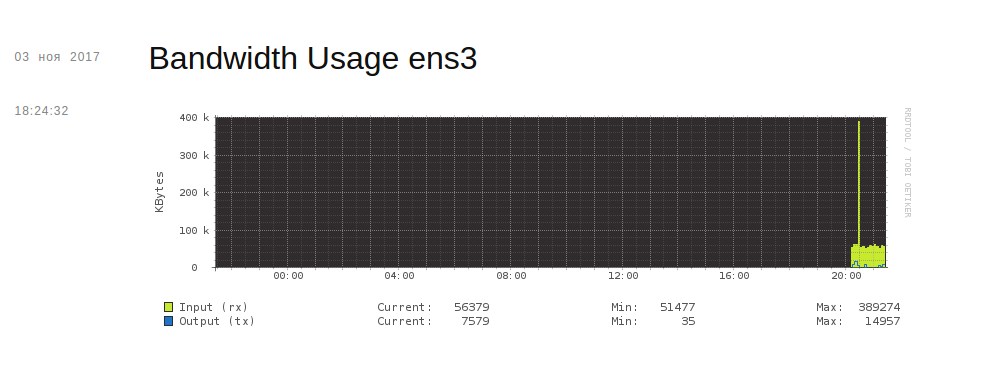
"Bandwidth Usage ens3"
This graph shows the traffic consumption on the server at a point in time.
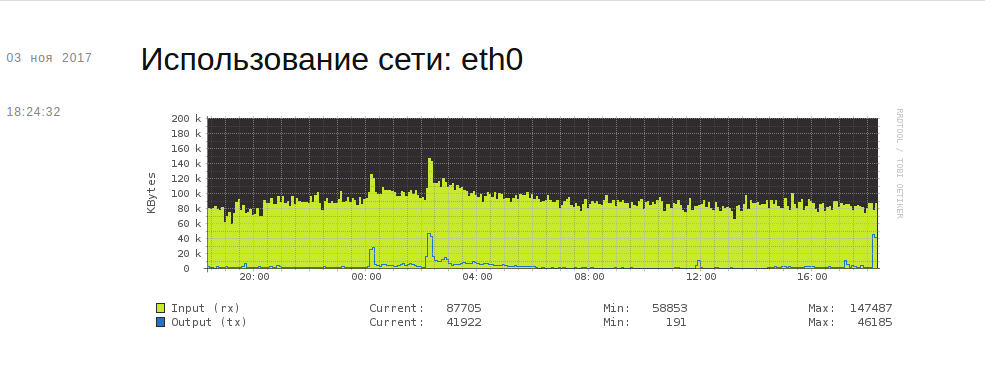
"Network usage: eth0"
This graph shows how the network is being used.
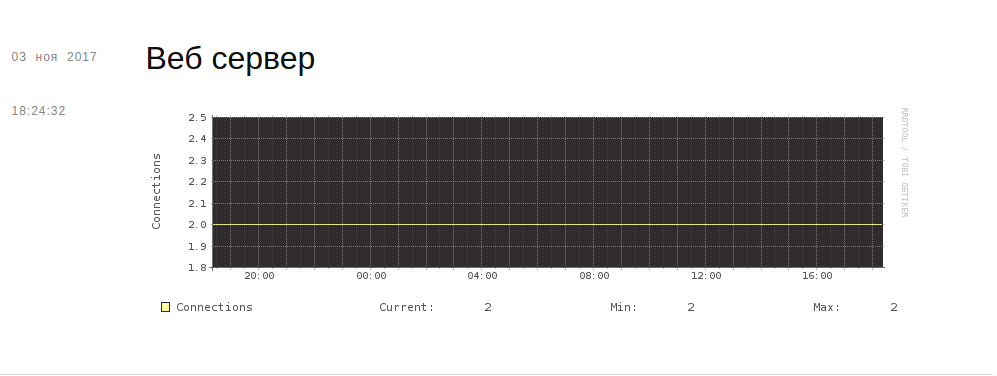
"Web Server"
This graph shows the number of connections to the web server at a point in time.
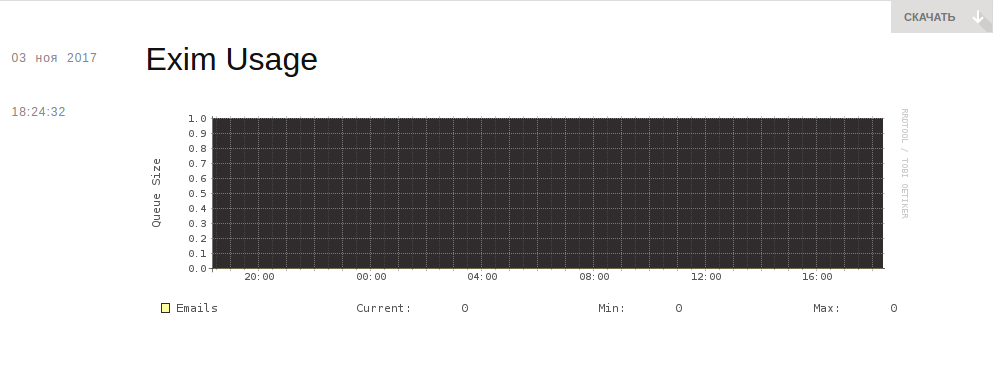
"Exim Usage"
This graph shows the number of emails in the mail queue at a point in time.
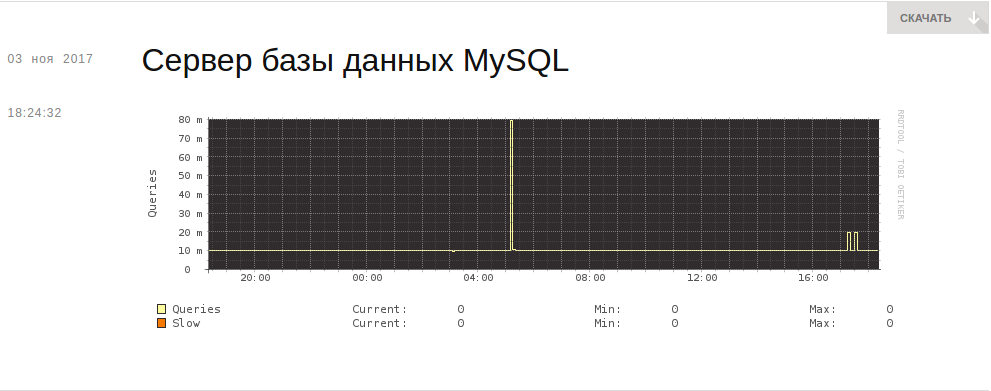
"MySQL database server"
This graph shows the number of active queries to the MySQL database at a point in time.
"FTP server"
This graph shows the number of FTP connections at a moment in time.

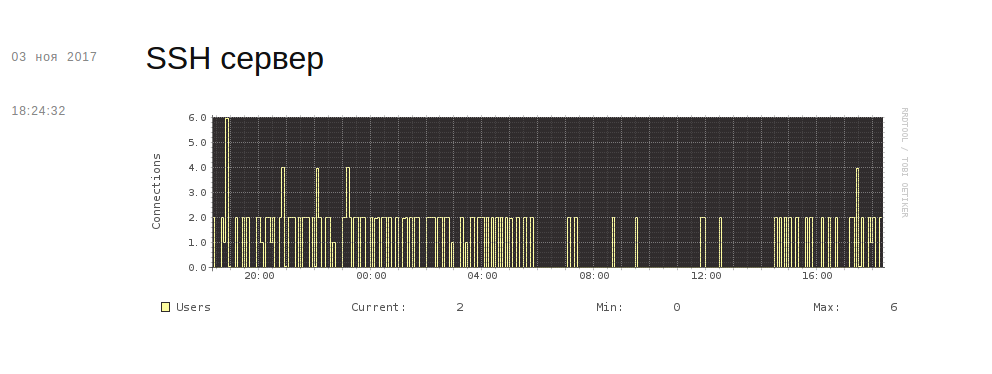
"SSH server"
This graph shows the number of connections at a time using the ssh protocol.