"atop " - advanced interactive full-screen performance monitor. It is analogous to top, but unlike it displays only new changes about active system processes. It allows you to monitor CPU, RAM, HDD, network loads, and load distribution among processes being processed. It is a convenient tool for system administration.
Installation
Debian/Ubuntu
apt install atop
Centos
yum install epel-release && yum install atop
Launch
All you have to do to start the atop service is to run it:
atop
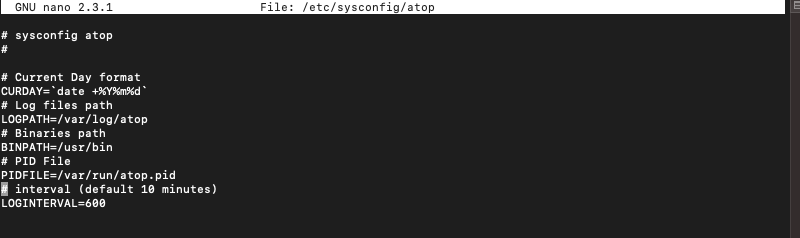
By default atop stores metrics every 10 minutes, you can change this value in /etc/default/atop or /etc/sysconfig/atop (variable INTERVAL).
An important feature is the ability to save data to a file of its own binary format, the atop process starts immediately after installation and continuously writes information to /var/log/atop.log.
The -r <путь_к_файлу> option <путь_к_файлу>specifies which dump will be read.
Let's look at the load log history of our server, using the command:
atop -r /var/log/atop/atop_20201130
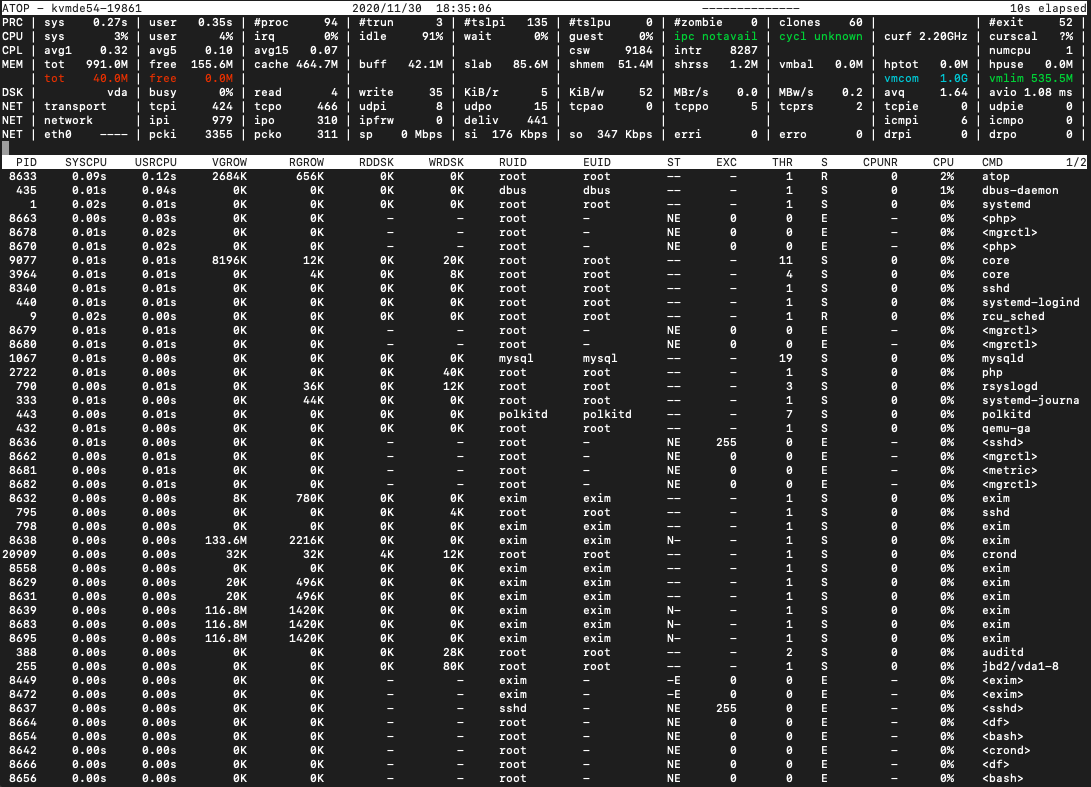
Popular atop utility commands:
- t - will jump to the next time slot;
- v - displays more detailed information about the processes (user, date and time when the process started);
- u - displays a table for the users that consume the most resources;
- g - will return everything to the original output;
- Shift + t - switches to the previous time interval;
- Shift + m - sorting processes by resident memory usage;
- Shift + c - sorting processes by CPU usage (by default);
- Shift + d - sorting processes by disk usage;
- Shift + n - sorting processes by network usage;
Main keys:
- b - since when you want to output the log
- e - until what time to output the log
If you have any difficulties in configuration or have any additional questions, you can always contact our support team via [Ticket system] (https://fornex.com/my/tickets/).