Advanced System Monitoring with atop
A guide to using atop to track CPU, memory, disk, network, and process usage
To monitor your server and quickly spot processes that consume excessive resources, the atop utility is very useful on VPS and dedicated servers. It provides insights into CPU, RAM, and swap usage.
atop is an advanced, full-screen performance monitor. Think of it as an enhanced version of top, but unlike top, it focuses on changes in active processes. It allows you to track CPU, RAM, disk, and network usage, as well as how resources are distributed among processes, making it a handy tool for system administration.
Installation
Debian/Ubuntu:
apt install atop
CentOS:
yum install epel-release && yum install atop
Running atop
To start the utility, simply run:
atop
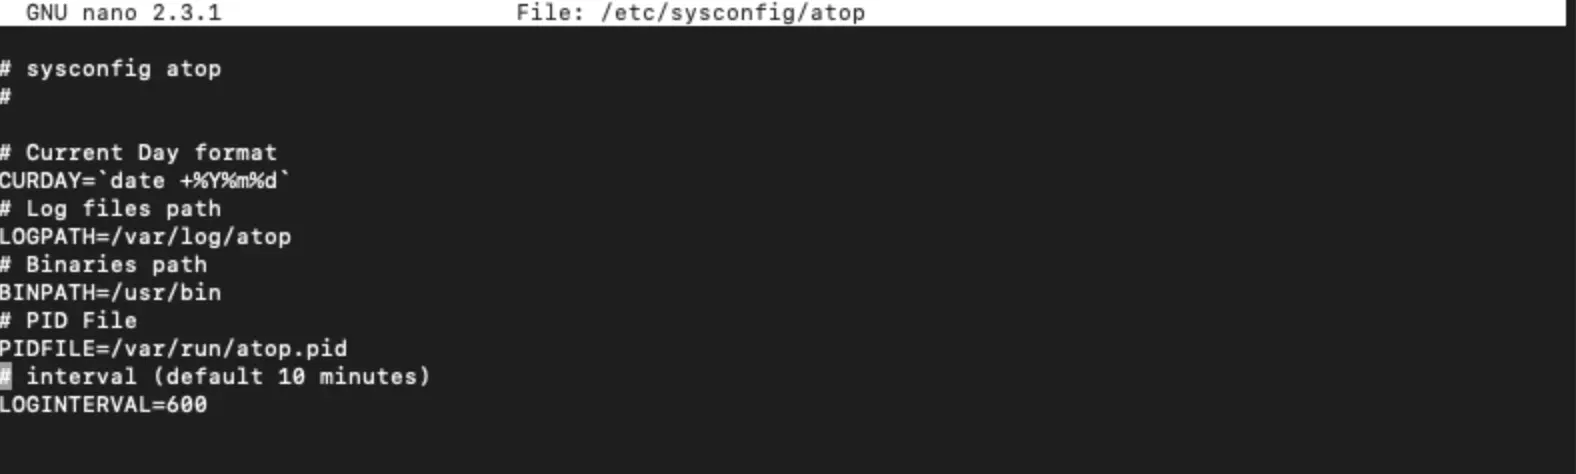
By default, atop collects metrics every 10 minutes. You can change this interval in /etc/default/atop or /etc/sysconfig/atop (variable INTERVAL).
One of the key features is the ability to save data to a binary log file. After installation, atop automatically starts logging to /var/log/atop.log.
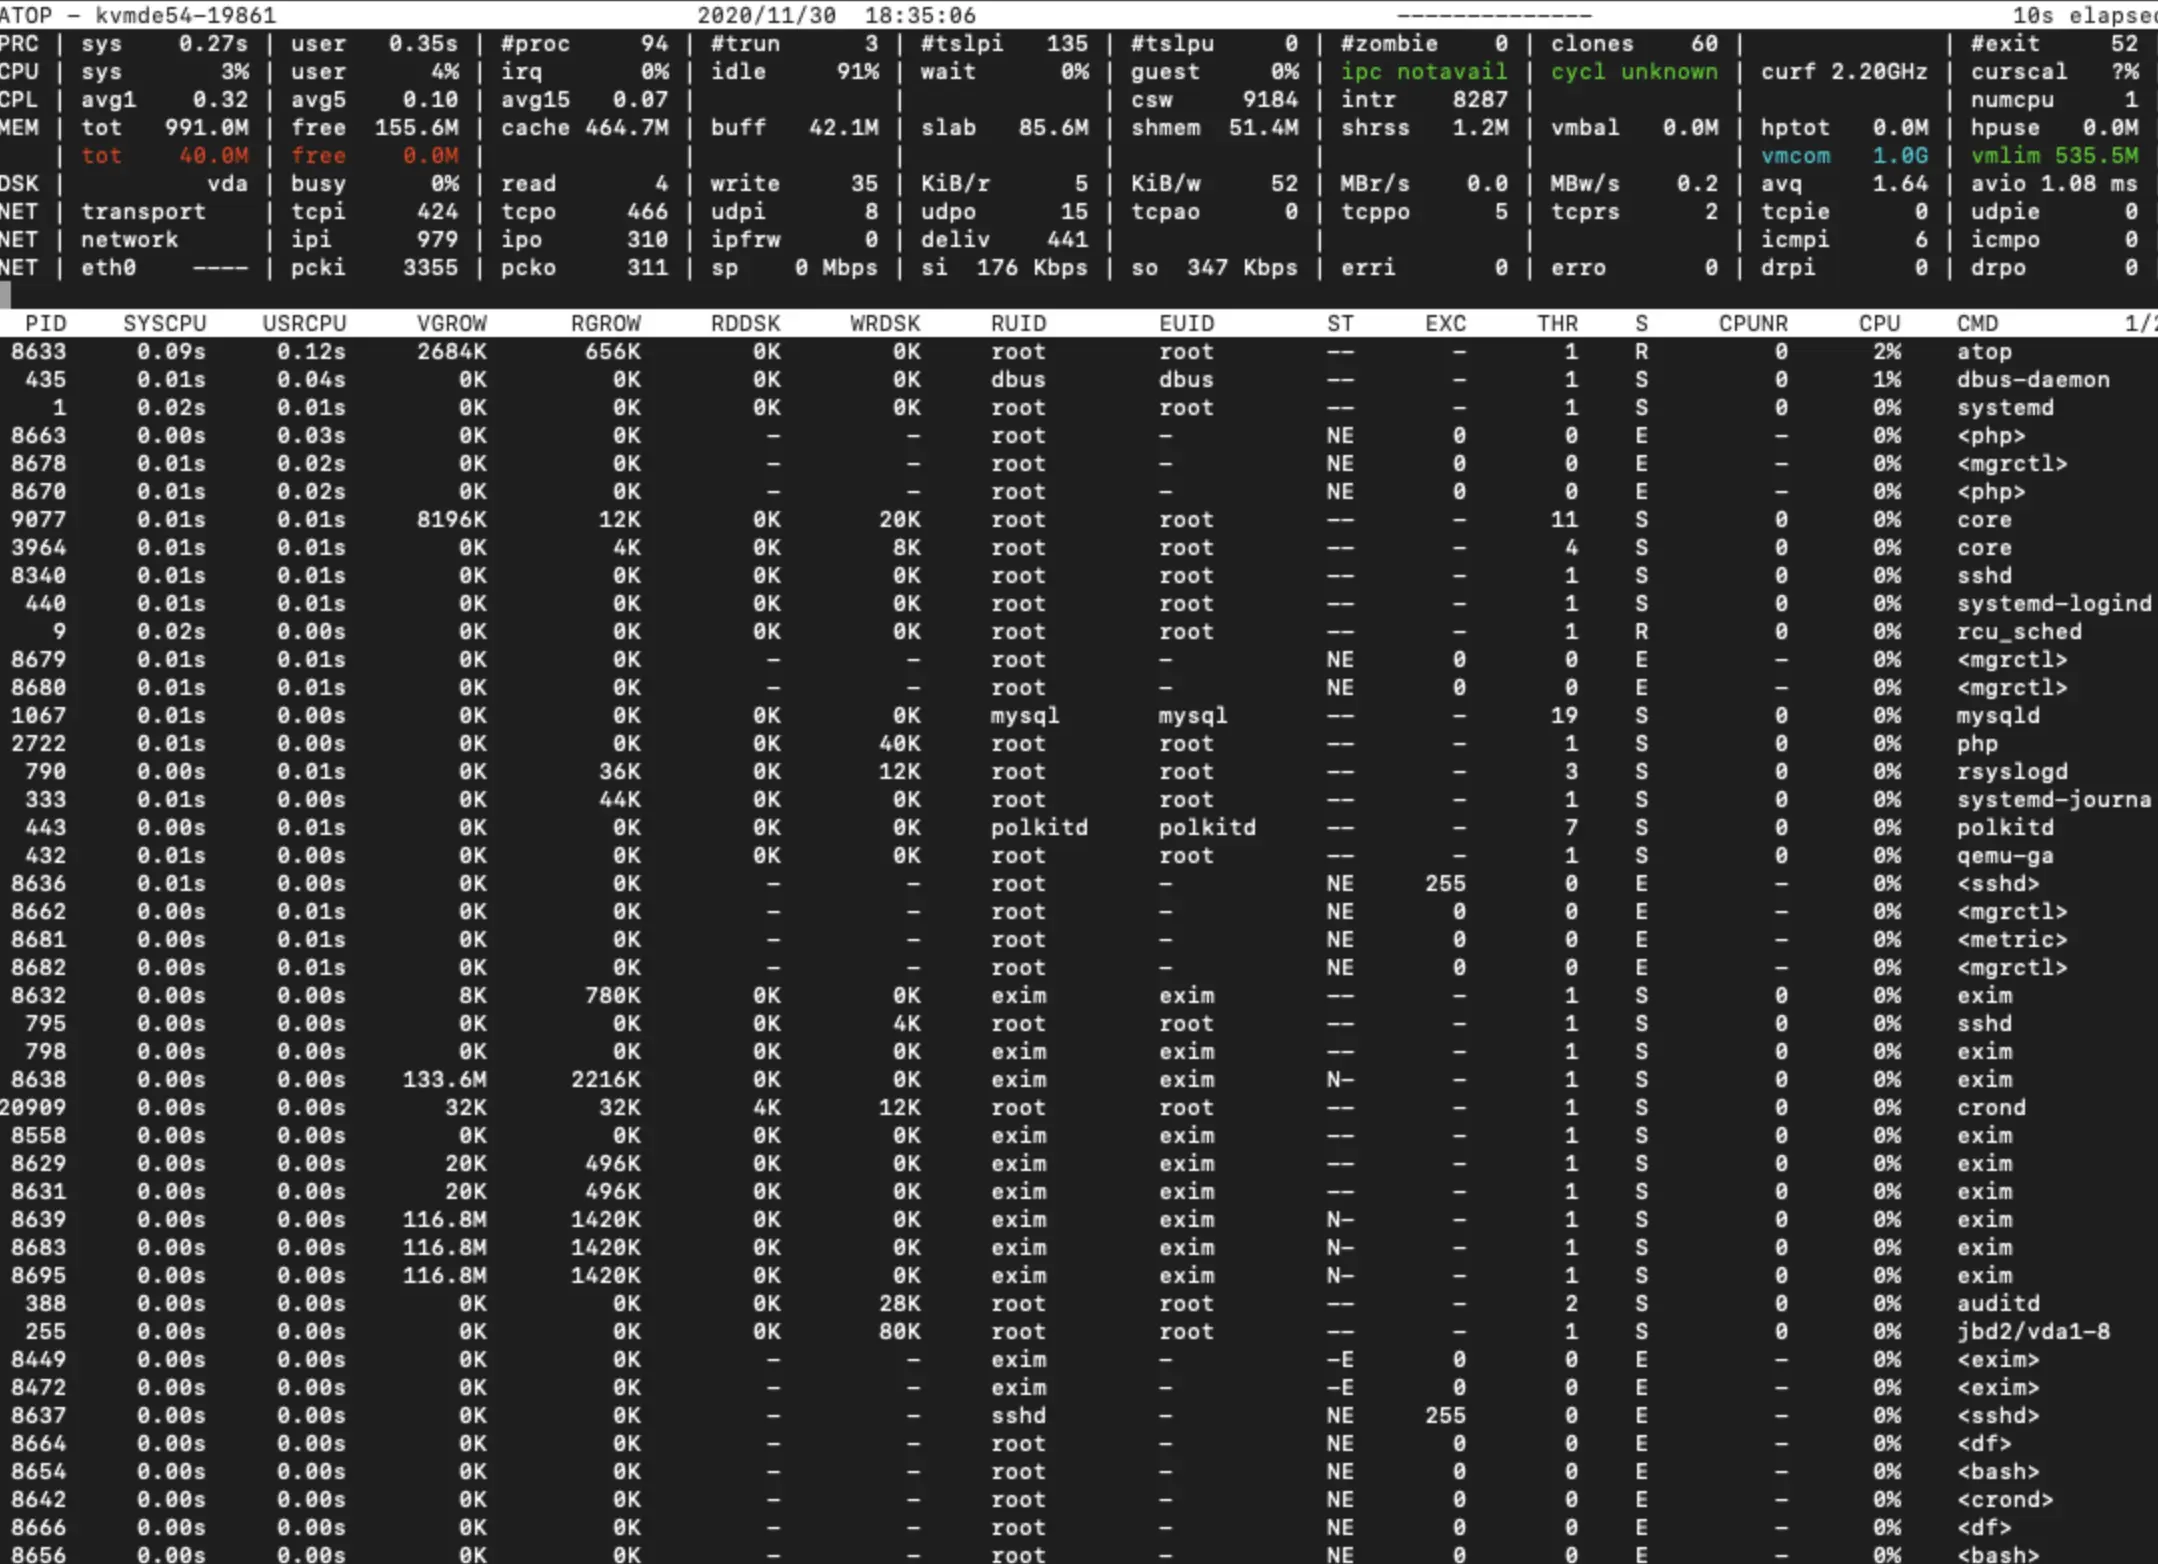
To review saved logs, use the -r <log_file> option. For example, to check your server’s historical load:
atop -r /var/log/atop/atop_20201130
Common atop commands
- t — move to the next time interval
- v — show detailed process information (user, start date/time)
- u — display resource usage by user
- g — reset to the default view
- Shift + t — move to the previous time interval
- Shift + m — sort processes by resident memory usage
- Shift + c — sort processes by CPU usage (default)
- Shift + d — sort processes by disk usage
- Shift + n — sort processes by network usage
Key options
- b — show logs starting from a specific time
- e — show logs up to a specific time
Help
If you run into any issues or have questions, you can always contact our support team through the ticket system.